For the first quarter 2022, the real estate market for single-family homes in Tampa – S. Petersburg – Clearwater metro area appears to be starting to level off with respect to the number of sales but continues to increase in overall home values.
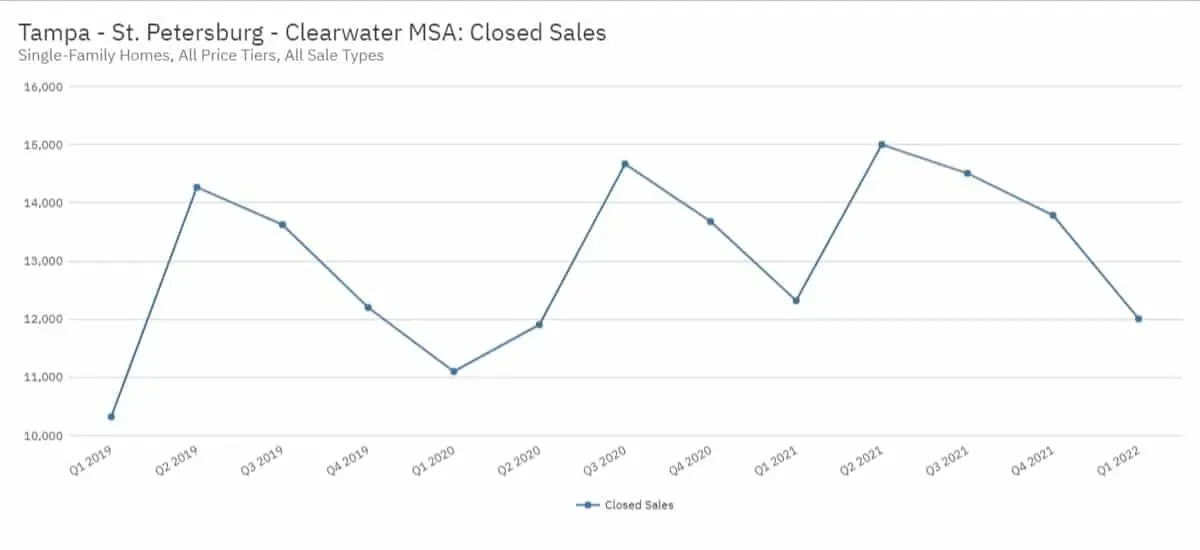
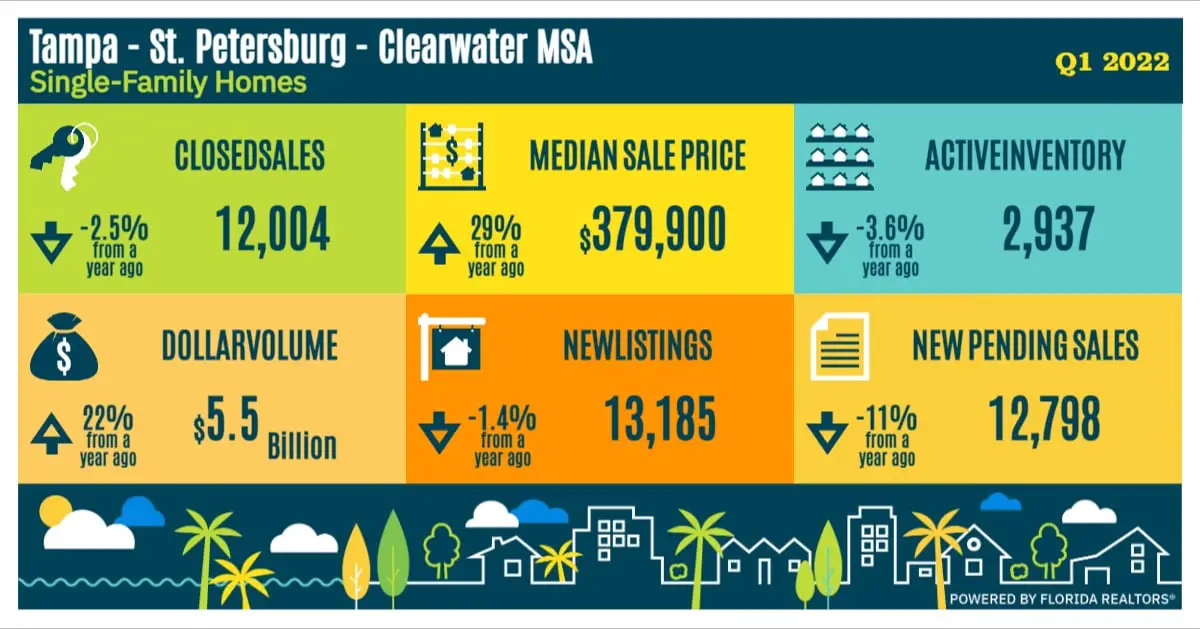
According to FloridaRealtors, there were a total of 12,004 existing single-family home sales throughout the greater Tampa Bay area during the first quarter 2021. This represents a 2.5% decline from the number of existing single-family sale transactions during the same period in 2021 (12,317). Of the total, approximately 30% or 3,915 transactions were conducted using cash.
The amount of closed sales have continued to increase based on the following historical levels.
- Q1 2022 – 12,004 (down 2.5% year-over-year)
- Q4 2021 – 13,784 (up 0.8% year-over-year)
- Q3 2021 – 14,507 (down 1.1% year-over-year)
- Q2 2021 – 15,001 (up 26% year-over-year)
- Q1 2021 – 11,966 (up 12% year-over-year)
- Q4 2020 – 13,735 (up 12.1%% year-over-year)
Based on the current level of activity, it is anticipated that the number of overall sales of existing single-family homes in the metro area will continue to decline due to limited inventory levels, rising interest rates and record high home prices.
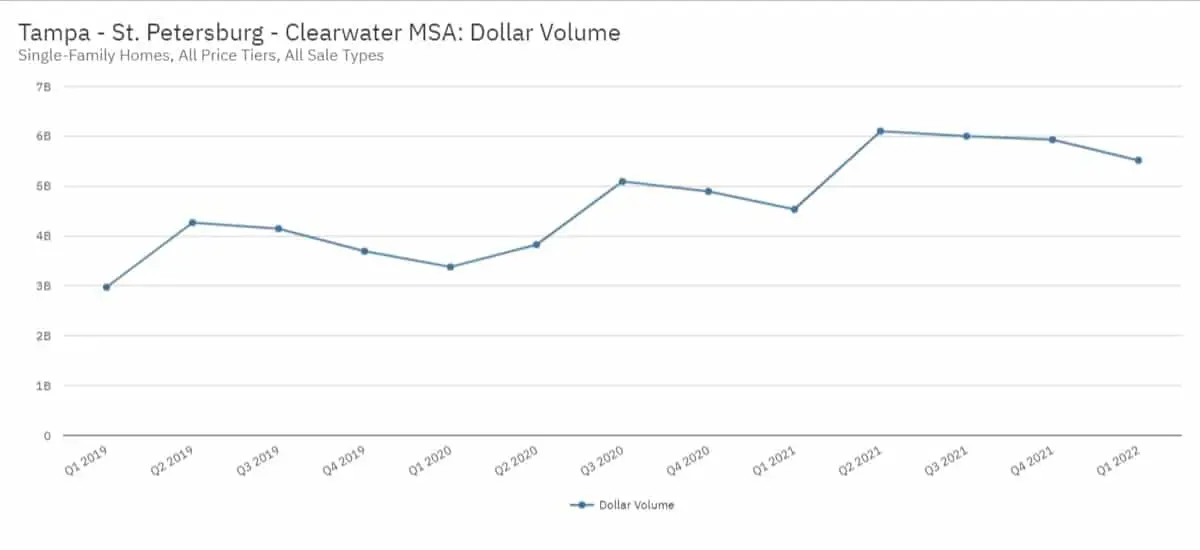
Overall dollar sales volume for the first quarter 2022 was $5.5 billion which is over 21.6% higher than the $4.5 billion amount realized during the same period in prior year. However, sales volume is down from it’s peak of $6.1 billion which occurred during the second quarter 2021.
- Q1 2022 – $5.5 billion (up 21.6% year-over-year)
- Q4 2021 – $5.9 billion (up 21.2% year-over-year)
- Q3 2021 – $6.0 billion (up 17.9% year-over-year)
- Q2 2021 – $6.1 billion (up 59.5% year-over-year)
- Q1 2021 – $4.5 billion (up 34.2% year-over-year)
- Q4 2020 – $4.9 billion (up 32.4% year-over-year)
Single Family Home Sale Prices (First Quarter 2022)
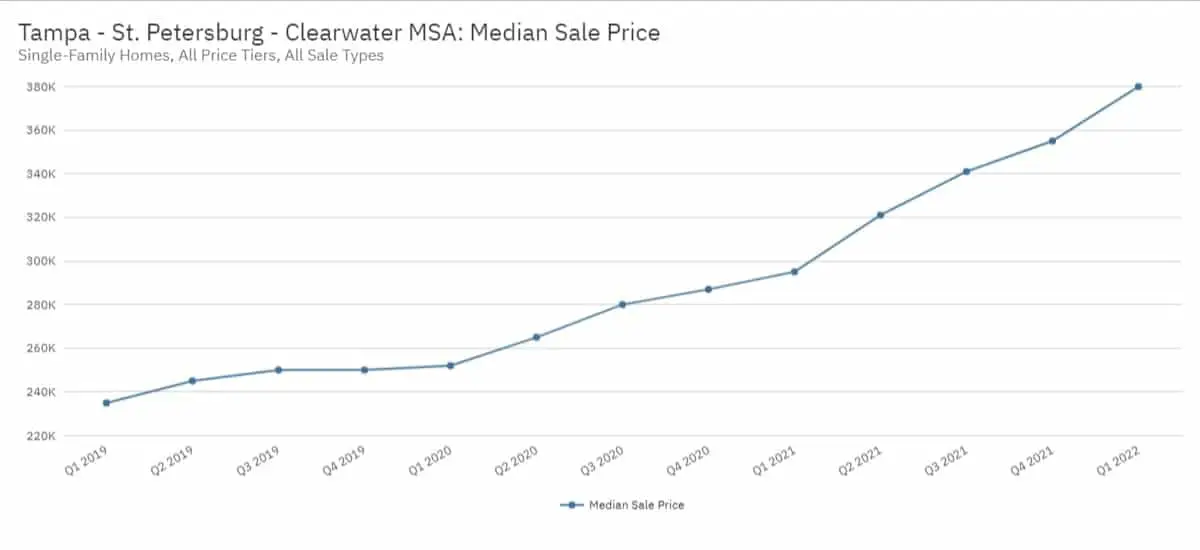
The median sale price is one of the preferred statistical methods for measuring price activity as it is not as sensitive of extraordinary high or low sale prices (that are not typical of a particular market area) which can easily skew the values.
For the first quarter 2022, the median sale price for existing single-family home sale transactions in greater Tampa Bay area was $379,900 which is 28.8% higher than that observed for during the first quarter 2021. This amount is the highest quarterly price observed in this market and the highest rate of growth.
- Q1 2022 – $379,900 (up 28.8% year-over-year)
- Q4 2021 – $354,990 (up 23.7% year-over-year)
- Q3 2021 – $340,990 (up 21.8% year-over-year)
- Q2 2021 – $320,995 (up 21.1% year-over-year)
- Q1 2021 – $295,000 (up 17.1% year-over-year)
- Q4 2020 – $286,995 (up 14.8%% year-over-year)
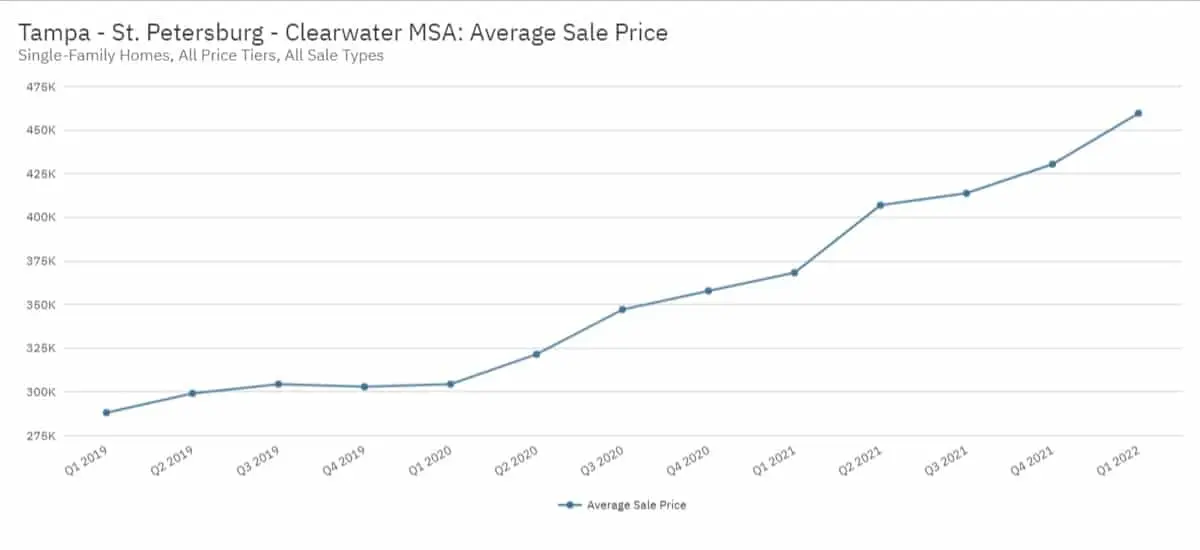
For the same period, the average sale price for single-family home sale transactions in the Tampa – S. Petersburg – Clearwater metro area was $459,640. This amount is 24.8% higher than the first quarter 2021 and largely driven by the 53.4% increase in the sale of homes over $1,000,000.
- Q1 2022 – $459,640 (up 24.8% year-over-year)
- Q4 2021 – $430,452 (up 20.3% year-over-year)
- Q3 2021 – $413,777 (up 19.2% year-over-year)
- Q2 2021 – $406,913 (up 26.6% year-over-year)
- Q1 2021 – $368,256 (up 21.0% year-over-year)
- Q4 2020 – $357,864 (up 18.1% year-over-year)
The number of homes sold above $300,000 continue to grow year-over-year by more than double digits with the number home sales above $1 million growing by more than 50%.
Affordability is continuing to become an issue as appreciation is limited the amount of homes being offered for sale at prices below $300,000.
| Closed Sales by Price | # of Sales | % Change (YOY) |
| Less than $50,000 | 2 | -77.8% |
| $50,000 – $99,999 | 28 | -75.4% |
| $100,000 – $149,999 | 145 | -72.6% |
| $150,000 – $199,999 | 478 | -62.5% |
| $200,000 – $249,999 | 999 | -51.6% |
| $250,000 – $299,999 | 1,413 | -39.9% |
| $300,000 – $399,000 | 3,604 | 25.1% |
| $400,000 – $599,000 | 3,437 | 81% |
| $600,000 – $999,999 | 1,375 | 61.2% |
| $1 million or more | 523 | 53.4% |
Single Family Home Inventory Levels (First Quarter 2022)
Inventory is the number of active property listings on the market for sale at any given point in time. This particular statistic is one of the main components in a healthy real estate market.
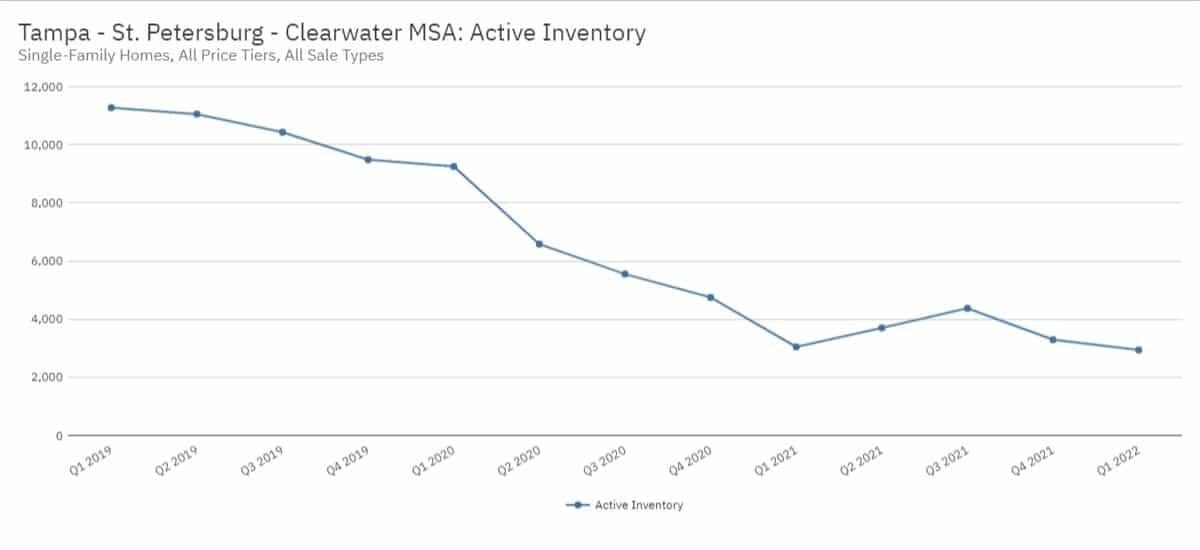
As of the end of the first quarter 2022, there were a staggeringly low 2,937 single-family homes available for sale throughout the Tampa Bay area which is a 3.6% decline from the amount of inventory as of the end of first quarter 2021. In the past three years, overall inventory has been extraordinary low compared to historical levels as evidenced by 11,270 homes available for sale in the first quarter 2019.
- Q1 2022 – 2,937 homes (down 3.6% year-over-year)
- Q4 2021 – 3,293 homes (down 30.6% year-over-year)
- Q3 2021 – 4,371 homes (down 21.2% year-over-year)
- Q2 2021 – 3,699 homes (down 43.8% year-over-year)
- Q1 2021 – 3,408 homes (down 67% year-over-year)
- Q4 2020 – 4,746 homes (down 49.9% year-over-year)
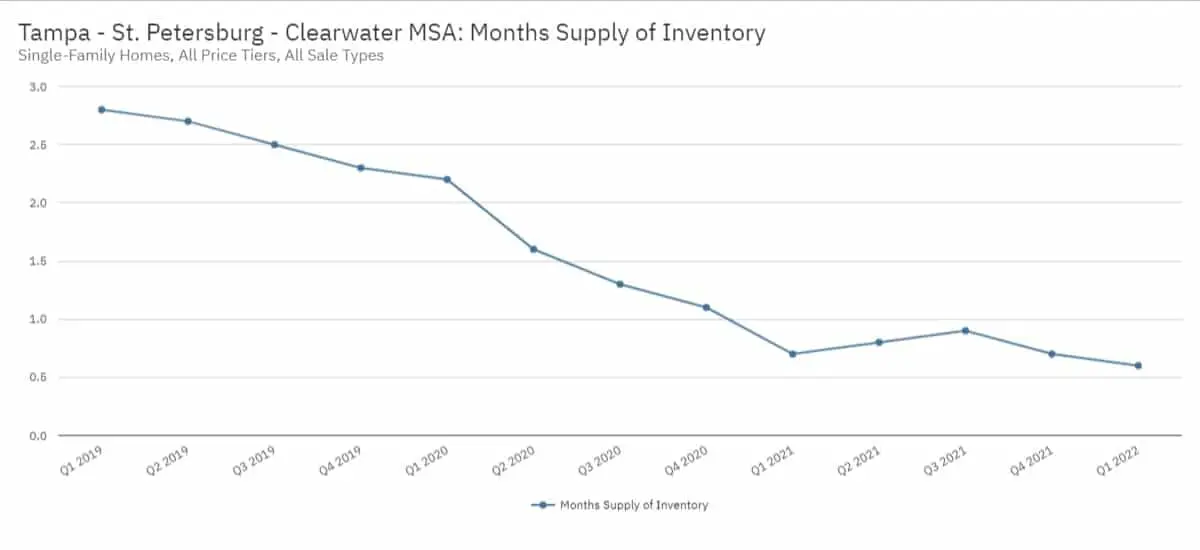
The monthly supply of single-family home inventory as of the end of the first was also historically low. At the current pace of sales, there is less than one month of inventory available for sale in the Tampa – S. Petersburg – Clearwater metro area which is down by more than 14% from the first quarter 2021.
- Q1 2022 – 0.6 months supply (down 14.3% year-over-year)
- Q4 2021 – 0.7 months supply (down 36.4% year-over-year)
- Q3 2021 – 0.9 months supply (down 30.8% year-over-year)
- Q2 2021 – 0.8 months supply (down 50.0% year-over-year)
- Q1 2021 – 0.7 months supply (down 68.2% year-over-year)
- Q4 2020 – 1.1 months supply (down 52.2% year-over-year)
Overall inventory is down substantially – the number of single-family home listings were new to the market during the first quarter 2022 decreased by 1.4% (from the first quarter 2021). It should be noted, however, there is an increase in listings from quarter-over-quarter (12,858 during Q4 2021).
- Q1 2022 – 13,185 homes (down 1.4% year-over-year)
- Q4 2021 – 12,858 homes (up 1.3% year-over-year)
- Q3 2021 – 15,906 homes (up 10.8% year-over-year)
- Q2 2021 – 16,304 homes (up 22.8% year-over-year)
- Q1 2021 – 13,372 homes (down 8.1% year-over-year)
- Q4 2020 – 12,693 homes (up 3.2% year-over-year)
Due to demand levels and low inventory, the number of new listings are increasingly higher price points continues to grow. Following is a table of new single-family listings at individual price points as of the end of the first quarter.
| Initial Listing Price Point | New Listings | % Change (YOY) |
| Less than $50,000 | 2 | -81.8% |
| $50,000 – $99,999 | 27 | -73.0% |
| $100,000 – $149,999 | 117 | -74.3% |
| $150,000 – $199,999 | 423 | -68.1% |
| $200,000 – $249,999 | 964 | -50.0% |
| $250,000 – $299,999 | 1,522 | -40.7% |
| $300,000 – $399,000 | 3,718 | 16.0% |
| $400,000 – $599,000 | 4,004 | 78.5% |
| $600,000 – $999,999 | 1,668 | 62.9% |
| $1 million or more | 740 | 41.5% |
As of the first quarter 2022, the following table will show the number of active property listings at individual price points.
| Current Listing Price Point | New Listings | % Change (YOY) |
| Less than $50,000 | 5 | -28.6% |
| $50,000 – $99,999 | 20 | -33.3% |
| $100,000 – $149,999 | 41 | -58.6% |
| $150,000 – $199,999 | 108 | -61.3% |
| $200,000 – $249,999 | 180 | -45.5% |
| $250,000 – $299,999 | 287 | -33.9% |
| $300,000 – $399,000 | 607 | -11.4% |
| $400,000 – $599,000 | 823 | 65.9% |
| $600,000 – $999,999 | 462 | 30.1% |
| $1 million or more | 404 | 21.7% |
Are you thinking of selling?
Based on the year-end 2021 data, the current state of the market is highly favorable for seller. If you are a homeowner and are considering selling your personal residence, vacation home or investment property, not may be the perfect time to do so.
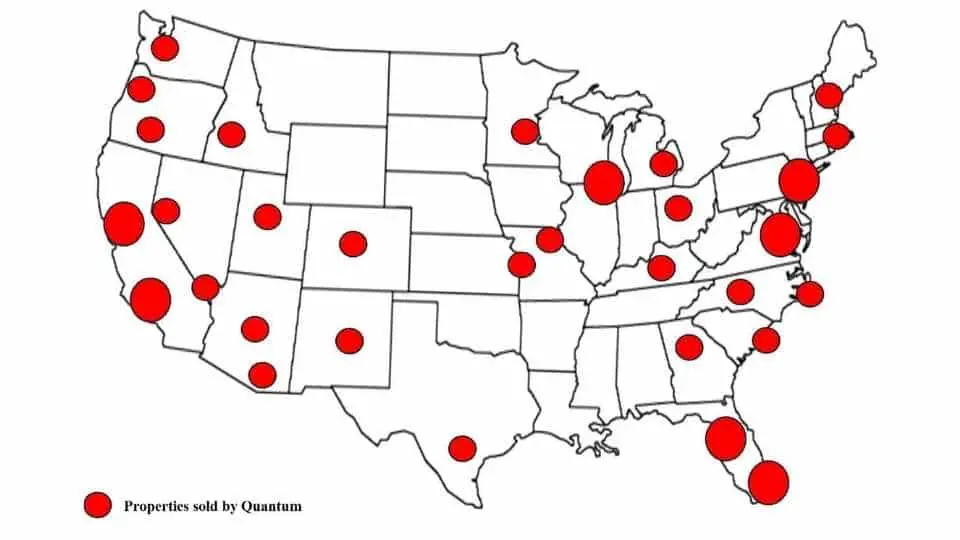
Our team has assisted sellers not only throughout the state of Florida, but in most major markets nationwide. We take a highly methodical and deliberate approach when working with or clients and have specific strategies to help get the best value for the property.
Contact us at info@quantumcos.com or learn more by visiting our web site at www.QuantumRealtyAdvisors.com.
The information provided in this website was derived from sources deemed to be reliable to is not guaranteed or warranted. All information, content, and materials available on this site are for general informational purposes only.
