There is now little doubt that the residential real estate market within the South Florida MSA (Miami-Dade, Broward and Palm Beach counties) has changed. As of June 2022, the single-family home market has experienced five straight months of declining year-over-year sales as well as ten out of the last 12 months. We continue to see, however, sale prices of single-family homes continuing to rise at a double-digit pace.
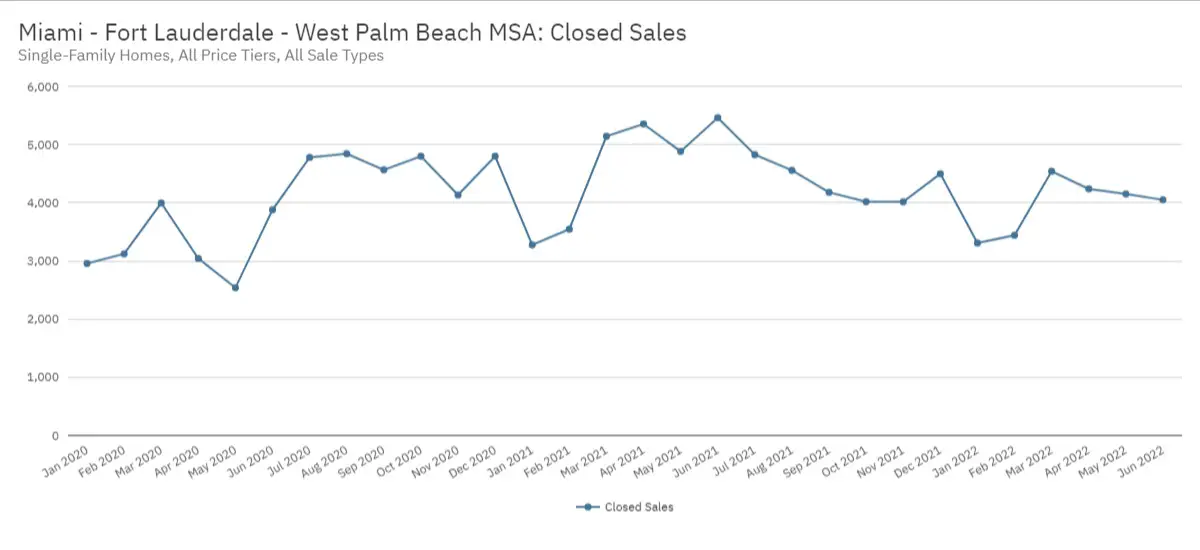
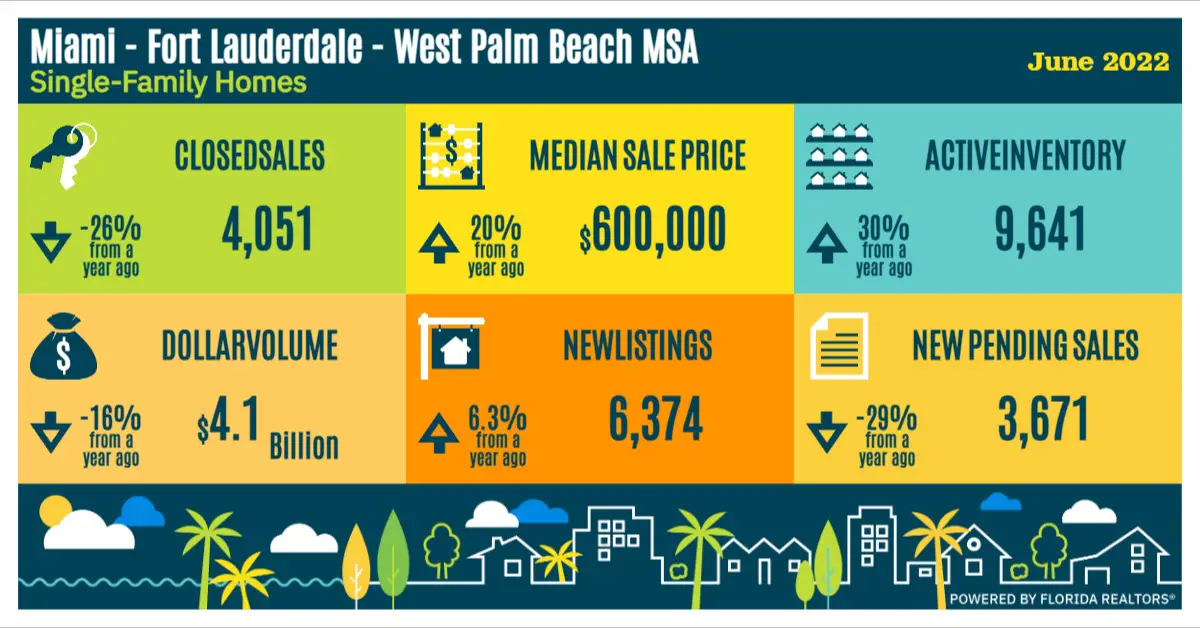
According to FloridaRealtors, there were a total of 4,051 existing single-family home sales throughout South Florida during the month of June 2022. This represents a 25.8% decline from the number of existing single-family sale transactions completed during the June 2022 (5,462).
The number of closed sales have declined within ten of the prior 12 months:
- June 2022 – 4,051 (down 25.8% year-over-year)
- May 2022 – 4,151 (down 15% year-over-year)
- April 2022 – 4,239 (down 20.8% year-over-year)
- March 2022 – 4,542 (down 11.7% year-over-year)
- February 2022 – 3,442 (down 3.0% year-over-year)
- January 2022 – 3,309 (up 1.0% year-over-year)
Based on the current level of activity, it is anticipated that the number of overall sales of existing single-family homes will continue to decline due to limited buyer demand, rising interest rates and exceedingly high home prices.
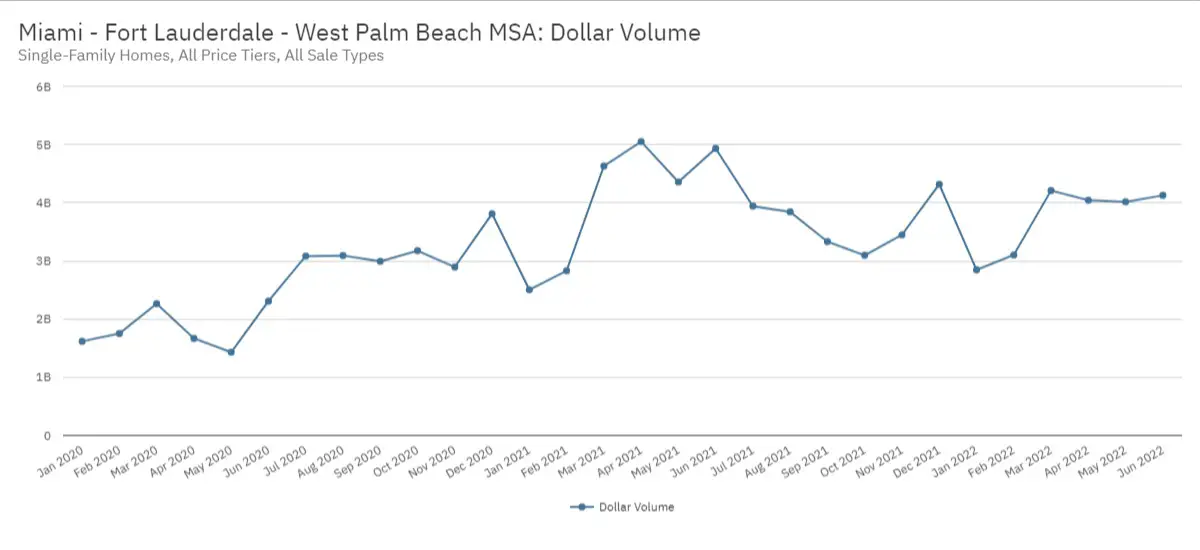
Overall dollar sales volume during the the month of June 2022 was $4.1 billion which represents a 16.3% year-over-year decline. This is also down from the YTD high in March 2022 of $4.2 billion and well behind the recent peak of $4.9 billion as of June 2021.
- June 2022 – $4.1 billion (down 16.3% year-over-year)
- May 2022 – $4.0 billion (down 15% year-over-year)
- April 2022 – $4.0 billion (down 19.9% year-over-year)
- March 2022 – $4.2 billion (down 9.1% year-over-year)
- February 2022- $3.1 billion (up 9.6% year-over-year)
- January 2022 – $2.8 billion (up 13.7% year-over-year)
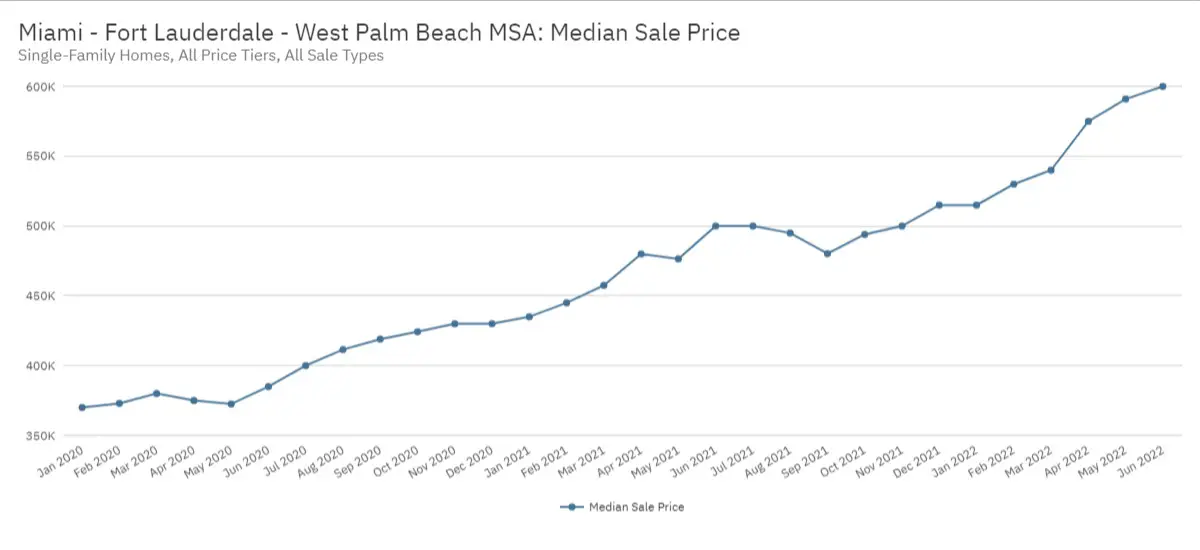
Single Family Home Sale Prices (June 2022)
The median sale price is one of the preferred statistical methods for measuring price activity as it is not as sensitive of extraordinary high or low sale prices (that are not typical of a particular market area) which can easily skew the values.
For the month of June 2022, the median sale price for existing single-family home sale transactions in South Florida was $600,000 which is 20% higher than that observed for during June 2021. Year-to-date 2022 the median sale price is up by 19.4%.
- June 2022 – $600,000 (up 20.0% year-over-year)
- May 2022 – $591,000 (up 24.0% year-over-year)
- April 2022 – $575,000 (up 19.8% year-over-year)
- March 2022 – $540,000 (up 18.0% year-over-year)
- February 2022 – $530,000 (up 19.1% year-over-year)
- January 2022 – $515,000 (up 18.4% year-over-year)
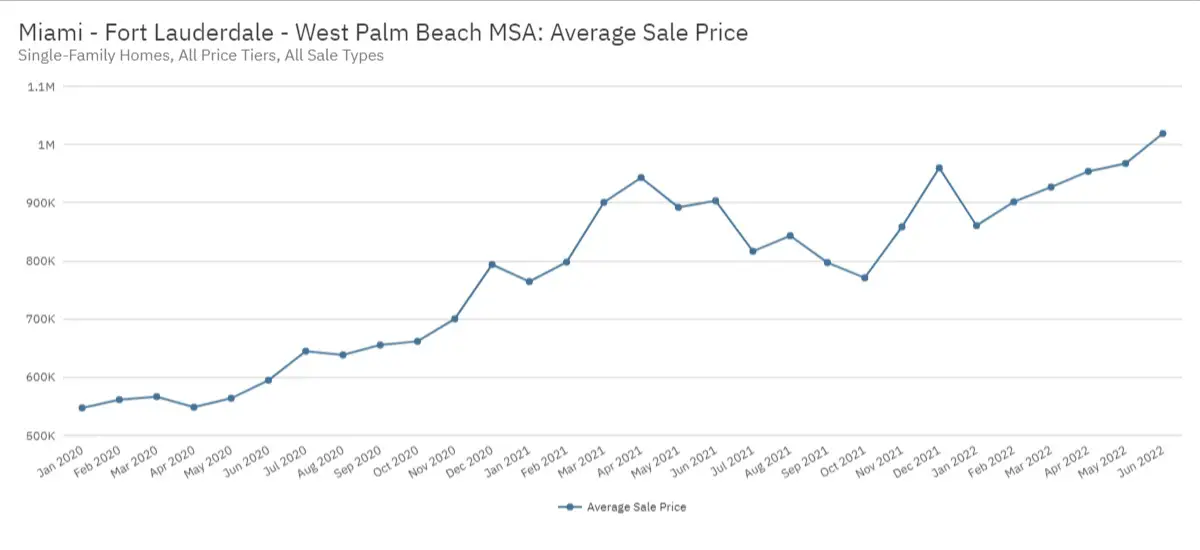
For the same period, the average sale price for single-family home sale transactions in South Florida was $1,019,037. This amount is 12.8% higher than June 2021 and considerably higher than the $860,681 average reported in January 2022. Year-to-date 2022 the average sale price is up by 7.2%.
- June 2022 – $1,019,037 (up 8.4% year-over-year)
- May 2022 – $967,571 (up 8.4% year-over-year)
- April 2022 – $953,970 (up 1.1% year-over-year)
- March 2022 – $926,914 (up 2.9% year-over-year)
- February 2022 – $901,562 (up 13.0% year-over-year)
- January 2022 – $860,681 (up 12.6% year-over-year)
Single Family Home Inventory Levels (June 2022)
Inventory is the number of active property listings on the market for sale at any given point in time. This particular statistic is one of the main components in a healthy real estate market.
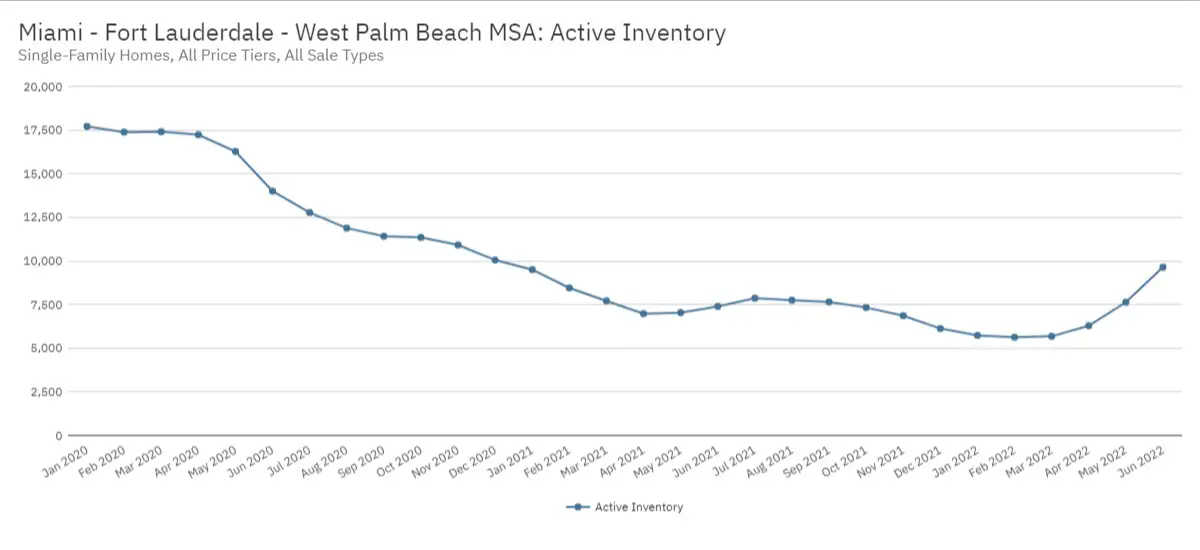
As of the end of June 2022, there were 9,641 existing single-family homes available for sale throughout South Florida. This is a 30.3% increase from the amount of inventory as of June 2021 as well as a substantial jump from May 2022 (7,636). It should be noted that year-to-date 2022 inventory is down by 13.8%.
In the past three years, overall inventory has been extraordinary low compared to historical levels.
- June 2022 – 9,641 homes (up 30.3% year-over-year)
- May 2022 – 7,636 homes (up 8.5% year-over-year)
- April 2022 – 6,286 homes (down 9.9% year-over-year)
- March 2022 – 5,682 homes (down 26.3% year-over-year)
- February 2022 – 5,628 homes (down 33.4% year-over-year)
- January 2022 – 5,734 homes (down 39.7% year-over-year)
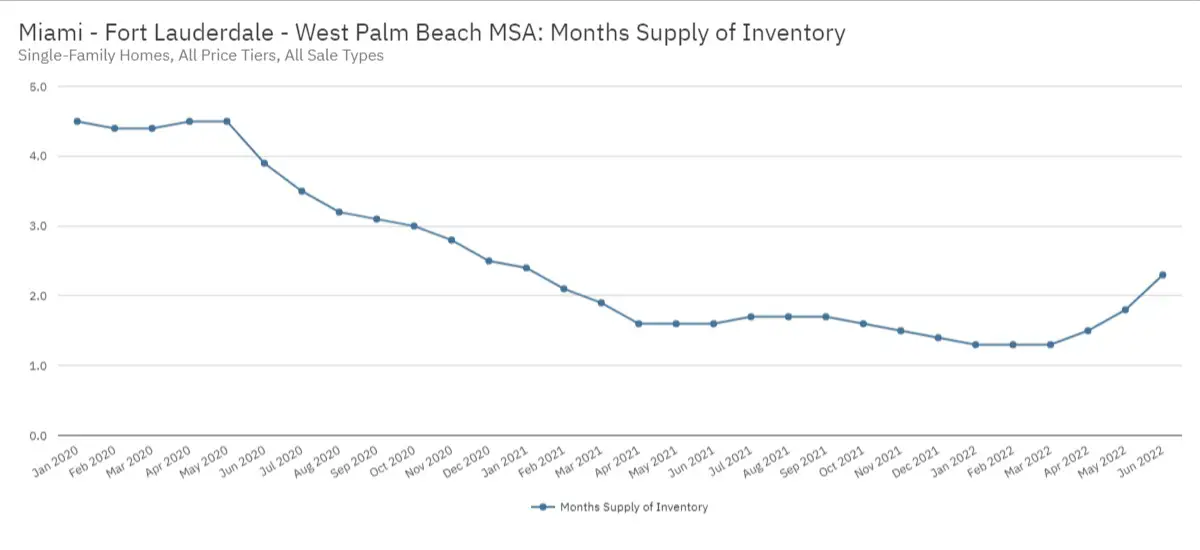
Although improving, the monthly supply of single-family home inventory as of the end of the June 2022 was also historically low. At the current pace of sales, there is 2.3 months of inventory available for sale throughout the three counties in South Florida.
- June 2022 – 2.3 months supply (up 43.8% year-over-year)
- May 2022 – 1.8 months supply (up 12.5% year-over-year)
- April 2022 – 1.5 months supply (down 6.3% year-over-year)
- March 2022 – 1.3 months supply (down 31.6% year-over-year)
- February 2022 – 1.3 months supply (down 38.1% year-over-year)
- January 2022 – 1.3 months supply (down 45.8% year-over-year)
Although overall inventory is down substantially, the number of new single-family home listings were put onto the market during the month of June 2022 increased by 6.3% (year-over-year) to 6,374 units. Year-to-date the number of new listings is down by 3.8%.
- June 2022 – 6,374 homes (up 6.3% year-over-year)
- May 2022 – 6,058 homes (up 2.5% year-over-year)
- April 2022 – 5,515 homes (down 8.1% year-over-year)
- March 2022 – 5,633 homes (down 8.5% year-over-year)
- February 2022 – 4,836 homes (down 4.2% year-over-year)
- January 2022 – 4,505 homes (down 11.8% year-over-year)
Based on the most current data, new listings are increasing at higher price points. Following is a table of new June 2022 single-family listings at individual price ranges.
| Initial Listing Price Point | New Listings | % Change (YOY) |
| Less than $50,000 | 6 | 100% |
| $50,000 – $99,999 | 4 | -60.0% |
| $100,000 – $149,999 | 16 | -48.4% |
| $150,000 – $199,999 | 29 | -70.4% |
| $200,000 – $249,999 | 60 | -63.2% |
| $250,000 – $299,999 | 156 | -50.6% |
| $300,000 – $399,000 | 680 | -41.5% |
| $400,000 – $599,000 | 1,910 | -4.6% |
| $600,000 – $999,999 | 1,981 | 54.6% |
| $1 million or more | 1,532 | 64.7% |
As of the end of June 2022, the following table will show the number of active property listings at individual price points.
| Current Listing Price Point | New Listings | % Change (YOY) |
| Less than $50,000 | 0 | -100% |
| $50,000 – $99,999 | 3 | -75.0% |
| $100,000 – $149,999 | 17 | -46.9% |
| $150,000 – $199,999 | 35 | -62.8% |
| $200,000 – $249,999 | 72 | -62.1% |
| $250,000 – $299,999 | 193 | -46.2% |
| $300,000 – $399,000 | 779 | -25.5% |
| $400,000 – $599,000 | 2,172 | 18.9% |
| $600,000 – $999,999 | 2,785 | 90.8% |
| $1 million or more | 3,586 | 50.7% |
Are you thinking of selling?
Based on the most recent data, the current state of the residential market is changing fast. If you are a homeowner and are considering selling your personal residence, vacation home or investment property, now may be the perfect time to do so while prices are still strong.
Our team has assisted sellers not only throughout the state of Florida, but in most major markets nationwide. We take a highly methodical and deliberate approach when working with or clients and have specific strategies to help get the best value for the property.
Contact us at info@quantumcos.com or learn more by visiting our web site at www.QuantumRealtyAdvisors.com.
The information provided in this website was derived from sources deemed to be reliable to is not guaranteed or warranted. All information, content, and materials available on this site are for general informational purposes only.
