For 2021, the Fort Myers – Cape Coral metro area continues to experience accelerated growth. Within the past year, sales trends improved as out-of-state buyers continue to relocate to Florida for its robust economy, warm weather and high quality of life.
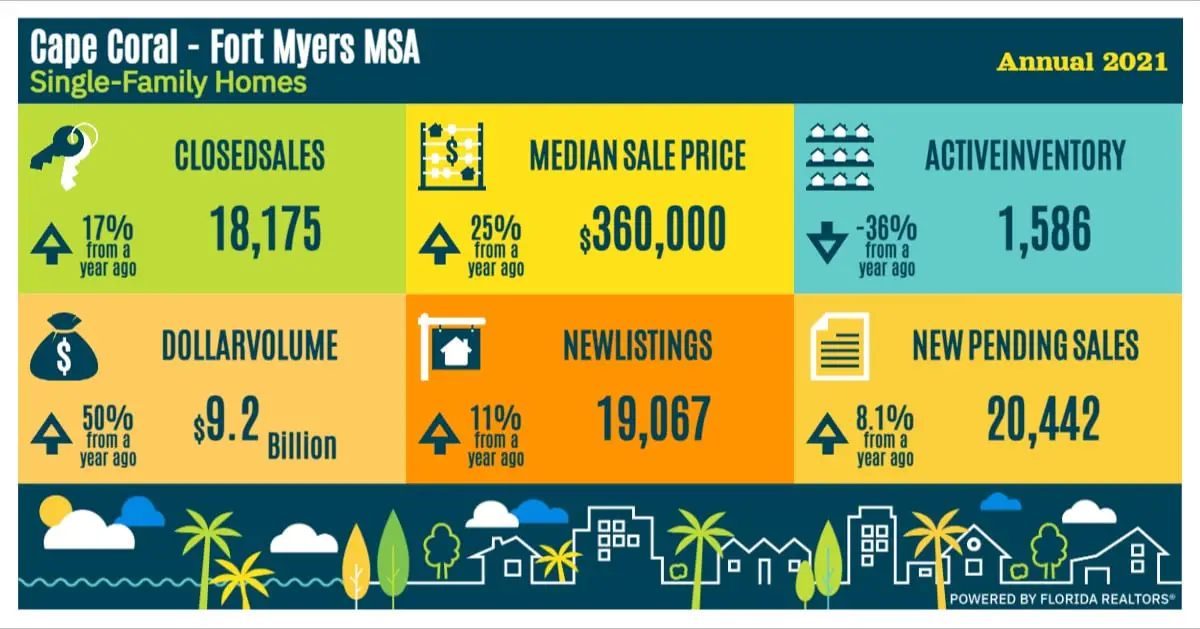
According to FloridaRealtors, there were a total of 18,175 existing single-family home sales throughout the greater Fort Myers area during 2021. This represents a 16.9% increase from the number of existing single-family sale transactions during 2020 (15,541). Of the total, approximately 35% or 6,493 transactions were conducted using cash.
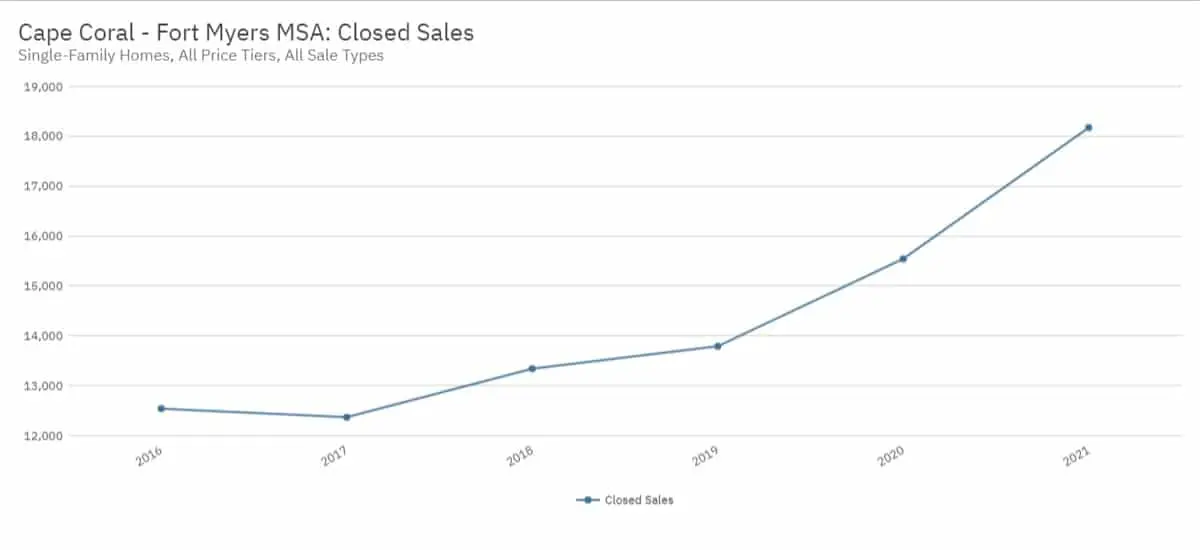
The amount of closed sales have continued to increase based on the following historical levels.
- 2021 – 18,175 (up 16.9% year-over-year)
- 2020 – 15,541 (up 12.7% year-over-year)
- 2019 – 13,788 (up 3.4% year-over-year)
- 2018 – 13,339 (up 7.9% year-over-year)
- 2017 – 12,365 (down 1.4% year-over-year)
- 2016 – 12,538 (down 6.0 year-over-year)
Based on the current level of activity, it is anticipated that the trend of increasing sales of existing single-family homes in the Fort Myers – Cape Coral metro area will continue for 2022 (provided there is sufficient inventory to accommodate the demand).
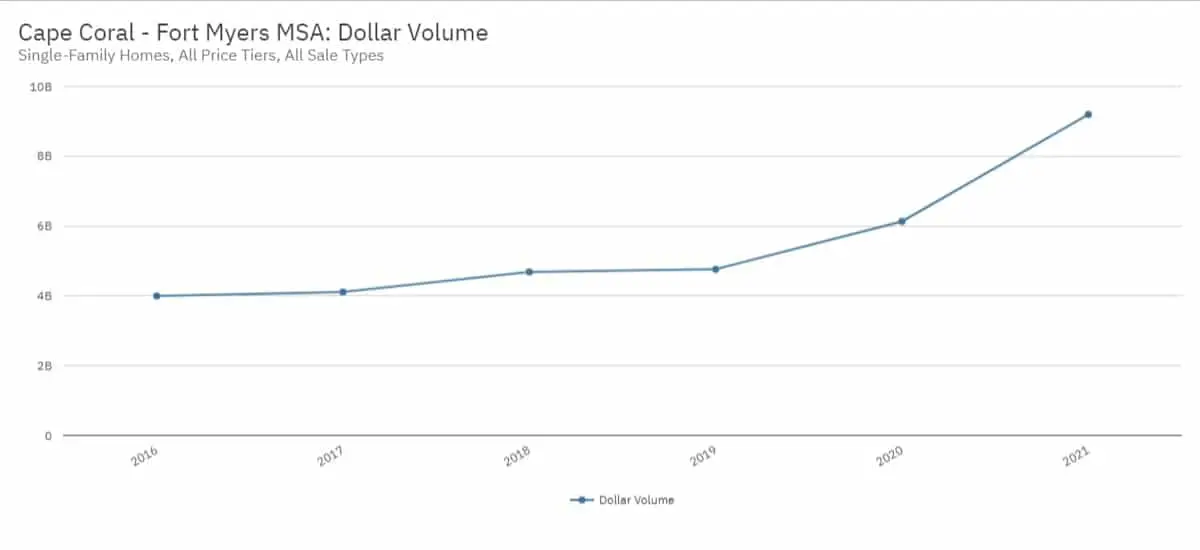
Overall dollar sales volume for 2021 was $9.2 billion which is 50% higher than the $6.1 billion amount realized during the prior year. For the past several years, dollar sales volume has continue to increase not only due to a growth in the number of transactions, but also the growth of single-family home values.
- 2021 – $9.2 billion (up 50% year-over-year)
- 2020 – $6.1 billion (up 28.8% year-over-year)
- 2019 – $4.8 billion (up 1.7% year-over-year)
- 2018 – $4.7 billion (up 14.0% year-over-year)
- 2017 – $4.1 billion (up 2.9% year-over-year)
- 2016 – $4.0 billion (down 2.1% year-over-year)
Single Family Home Sale Prices (Year End 2021)
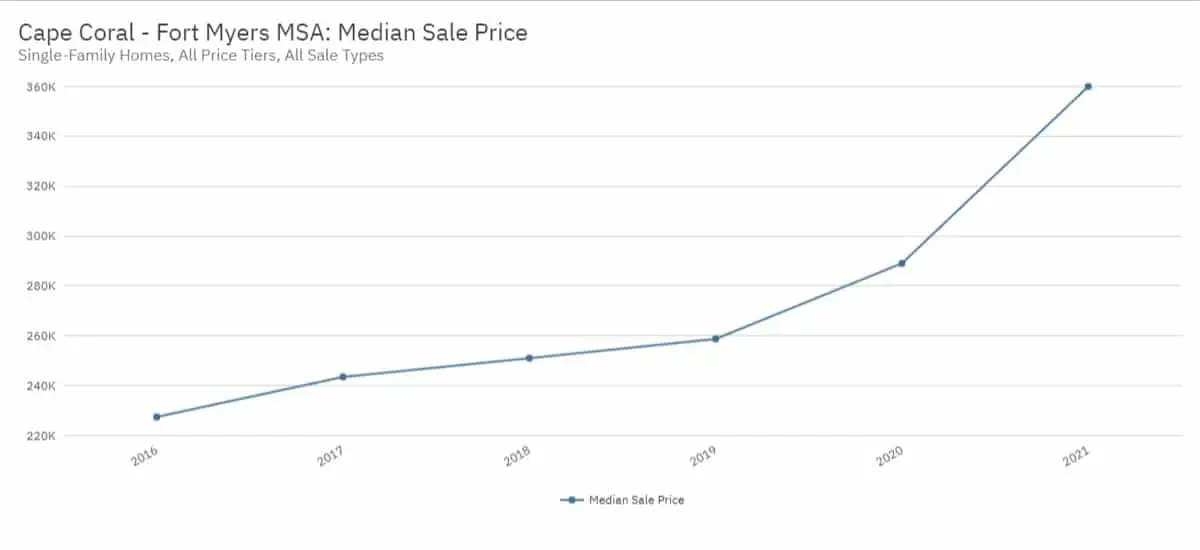
The median sale price is one of the preferred statistical methods for measuring price activity as it is not as sensitive of extraordinary high or low sale prices (that are not typical of a particular market area) which can easily skew the values.
For 2021, the median sale price for single-family home sale transactions in the greater Fort Myers area was $360,000 which is more than 24% higher than that observed for 2020.
- 2021 – $360,000 (up 24.6% year-over-year)
- 2020 – $289,000 (up 11.7% year-over-year)
- 2019 – $258,728 (up 3.1% year-over-year)
- 2018 – $251,000 (up 3.1% year-over-year)
- 2017 – $243,500 (up 7.1% year-over-year)
- 2016 – $227,400 (up 8.3% year-over-year)
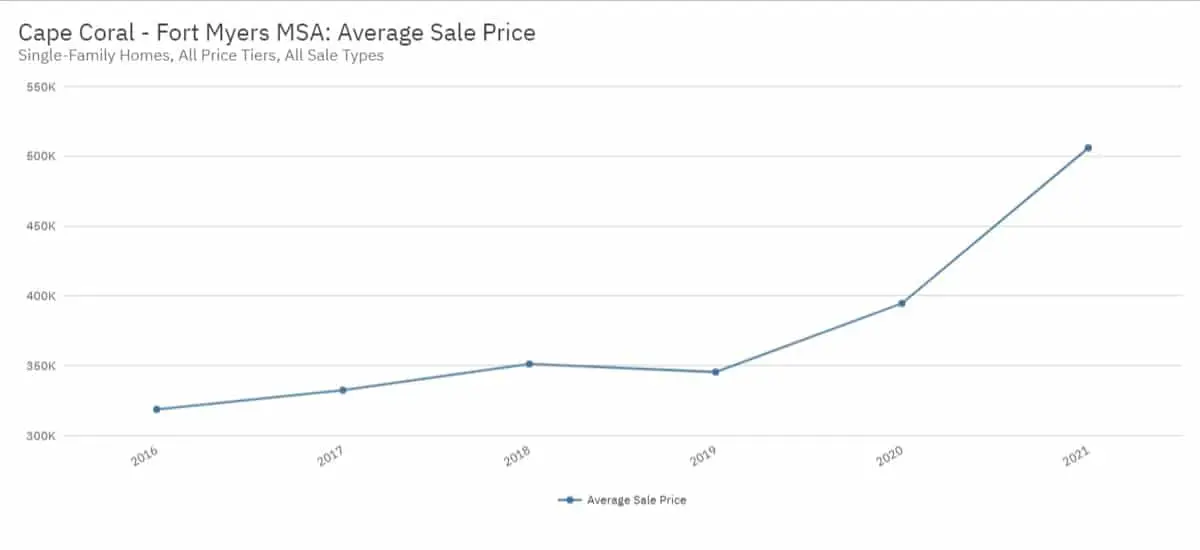
For the same period, the average sale price for single-family home sale transactions in the Fort Myers – Cape Coral metro area was $506,033. This amount is 28.2% higher than 2020 and largely driven by the 97% increase in the sale of homes over $1,000,000.
- 2021 – $506,033 (up 28.2% year-over-year)
- 2020 – $394,618 (up 14.2% year-over-year)
- 2019 – $345,402 (down 1.6% year-over-year)
- 2018 – $351,187 (up 5.6% year-over-year)
- 2017 – $332,427 (up 4.3% year-over-year)
- 2016 – $318,666 (up 4.1% year-over-year)
Single Family Home Inventory Levels (Year End 2021)
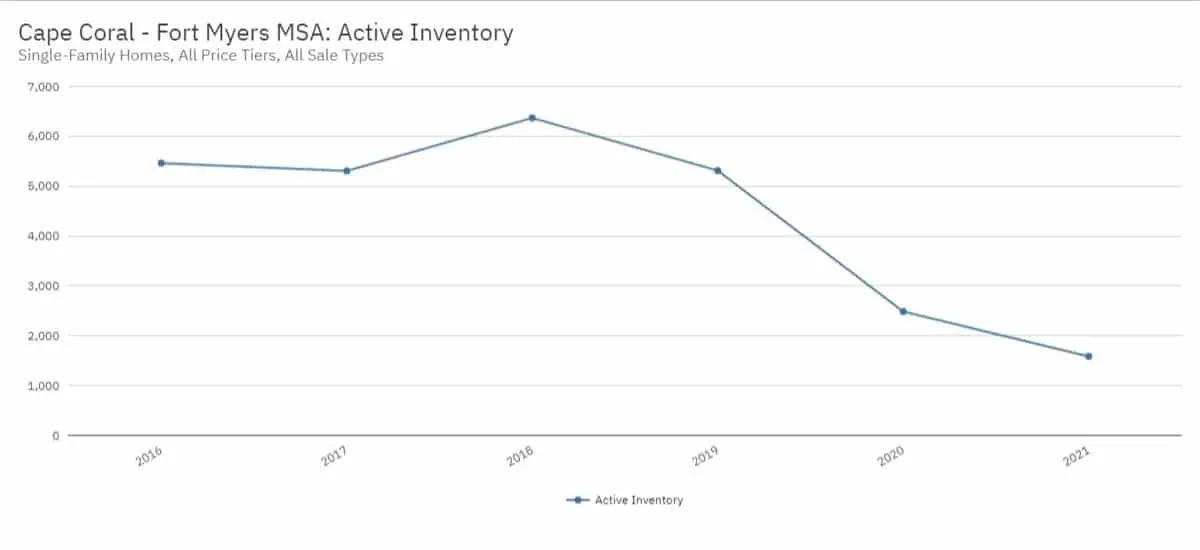
Inventory is the number of active property listings on the market for sale at any given point in time. This particular statistic is one of the main components in a healthy real estate market.
As of the year-end 2021, there were only 2,650 single-family homes available for sale throughout the Fort Myers metro area which is greater than a 35% decline from the amount of inventory as of the end of 2020. In the past two years, overall inventory has been extraordinary low compared to historical levels.
- 2021 – 1,586 homes (down 36.2% year-over-year)
- 2020 – 2,485 homes (down 53.2% year-over-year)
- 2019 – 5,312 homes (down 16.6% year-over-year)
- 2018 – 6,367 homes (up 20.0% year-over-year)
- 2017 – 5,305 homes (down 2.9% year-over-year)
- 2016 – 5,463 homes (up 11.4% year-over-year)
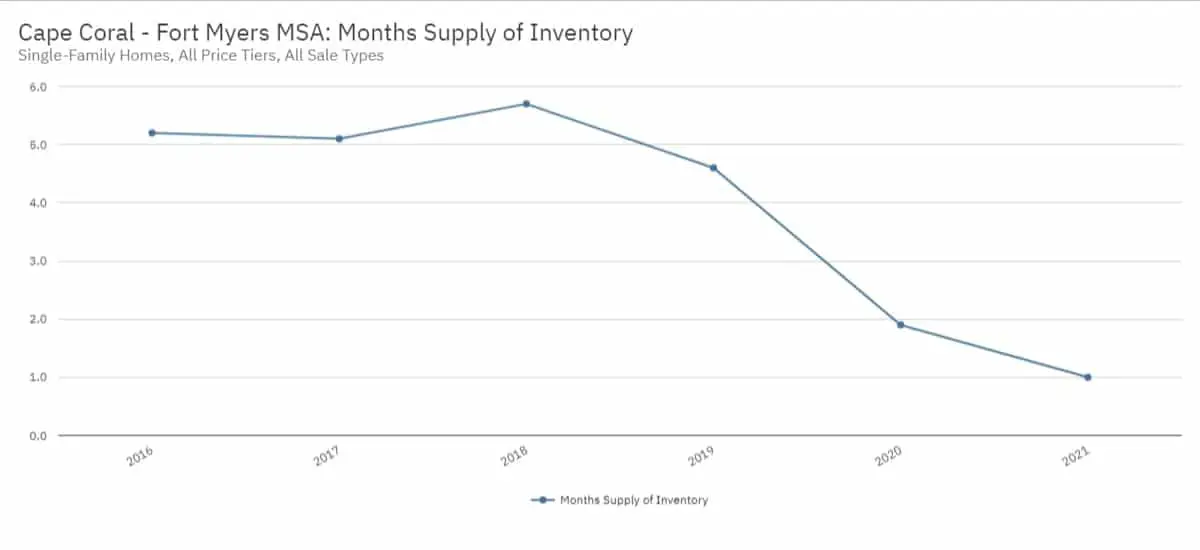
The months supply of single-family home inventory as of the year-end was also historically low. At the current pace of sales, there is one month of inventory available for sale in the Fort Myers – Cape Coral metro area (as of year-end 2021) which is down by more than 45% from 2020.
- 2021 – 1.0 months supply (down 47.4% year-over-year)
- 2020 – 1.9 months supply (down 58.7% year-over-year)
- 2019 – 4.6 months supply (down 19.3% year-over-year)
- 2018 – 5.7 months supply (up 11.8% year-over-year)
- 2017 – 5.1 months supply (down 1.9% year-over-year)
- 2016 – 5.2 months supply (up 18.2% year-over-year)
Although overall inventory is down substantially, the number of new single-family home listings were put onto the market during 2021 increased by 11.0% (from YE 2020) to 19,067 as sellers take advantage of the increasing prices.
- 2021 – 19,067 homes (up 11.0% year-over-year)
- 2020 – 17,175 homes (down 1.2% year-over-year)
- 2019 – 17,384 homes (down 5.1% year-over-year)
- 2018 – 18,309 homes (up 12.1% year-over-year)
- 2017 – 16,330 homes (down 4.0% year-over-year)
- 2016 – 17,014 homes (up 3.5% year-over-year)
Due to demand levels and low inventory, the number of new listings are increasingly higher price points continues to grow. Following is a table of new 2021 single-family listings at individual price points.
| Initial Listing Price Point | New Listings | % Change (YOY) |
| Less than $50,000 | 3 | -79.6% |
| $50,000 – $99,999 | 154 | -48.6% |
| $100,000 – $149,999 | 238 | -48.4% |
| $150,000 – $199,999 | 850 | -57.7% |
| $200,000 – $249,999 | 1,834 | -44.4% |
| $250,000 – $299,999 | 3,118 | 17.5% |
| $300,000 – $399,000 | 4,827 | 43.0% |
| $400,000 – $599,000 | 4,115 | 46.0% |
| $600,000 – $999,999 | 2,667 | 72.2% |
| $1 million or more | 1,351 | 52.7% |
As of the year end 2021, the following table will show the number of active property listings at individual price points.
| Current Listing Price Point | New Listings | % Change (YOY) |
| Less than $50,000 | 0 | NA |
| $50,000 – $99,999 | 5 | -44.4% |
| $100,000 – $149,999 | 9 | -82.0% |
| $150,000 – $199,999 | 38 | -74.5% |
| $200,000 – $249,999 | 54 | -83.0% |
| $250,000 – $299,999 | 158 | -55.4% |
| $300,000 – $399,000 | 393 | -9.2% |
| $400,000 – $599,000 | 383 | -6.4% |
| $600,000 – $999,999 | 297 | -18.0% |
| $1 million or more | 249 | -38.1% |
Are you thinking of selling?
Based on the year-end 2021 data, the current state of the market is highly favorable for seller. If you are a homeowner and are considering selling your personal residence, vacation home or investment property, not may be the perfect time to do so.
Our team has assisted sellers not only throughout the state of Florida, but in most major markets nationwide. We take a highly methodical and deliberate approach when working with or clients and have specific strategies to help get the best value for the property.
Contact us at info@quantumcos.com or learn more by visiting our web site at www.QuantumRealtyAdvisors.com.
The information provided in this website was derived from sources deemed to be reliable to is not guaranteed or warranted. All information, content, and materials available on this site are for general informational purposes only.
