
According to the National Association of Realtors, existing US home sales have fallen for twelve consecutive months which continues the longest streak of sale declines since 1999. Individual sales transactions were down 36.9% year-over-year to a seasonally adjusted annual rate of 4.0 million units.
According to Lawrence Yun, NAR’s chief economist, “Home sales are bottoming out,”. He further stated, “Prices vary depending on a market’s affordability, with lower-priced regions witnessing modest growth and more expensive regions experiencing declines.”
Median existing home prices across all property types continue to rise. As of the end of January 2023, the median price was up 1.3% (year-over-year) to $359,000. This marks 131 consecutive months of year-over-year median home price increases which is the longest-running streak on record.
Existing home inventory was up 15.3% to 980,000 units and based on the current pace of sales, there is a 2.9-month supply of homes on the market at this time. The average marketing time for January 2023 was 33 days, up from 19 as of January 2022 and 26 days from the prior month.
Foreclosures and short sales represented just 1% of all sales in January 2023.
The Florida Housing Market
Due to a combination of rising interest and slowing buyer demand, closed sale transactions across the state of Florida declined by 34.7% during the month of January 2023. Sales of single-family homes were down by 32.5% while condominium & townhomes are down by 40.7%.
During the month of November 2022, the housing market in the state of Florida has more inventory and higher median prices as compared to a year ago.
Dr. Brad O’Connor, Chief Economist for the Florida Realtors, continues to state that interest rates continue to adversely impact the market stating “High mortgage rates are not only affecting homebuyers”. He continued indicating, “They’re also discouraging some potential sellers from listing their homes for sale, as well – particularly those who would be selling their primary residence and would therefore have to finance their next home at these higher rates.
Inventory across Florida continues to improve, up 134.2% for single-family homes and 90% for condominiums & townhome units. Based on the current rate of home sales, there is a 3.1-month supply of inventory currently available as of the end of January.
Closed Sales – January 2023
The number of closed sales transactions within the state of Florida has declined (year-over-year) for the last year. As of January 2023, the number of individual closed sales declined by 34.7% to 21,825 transactions.
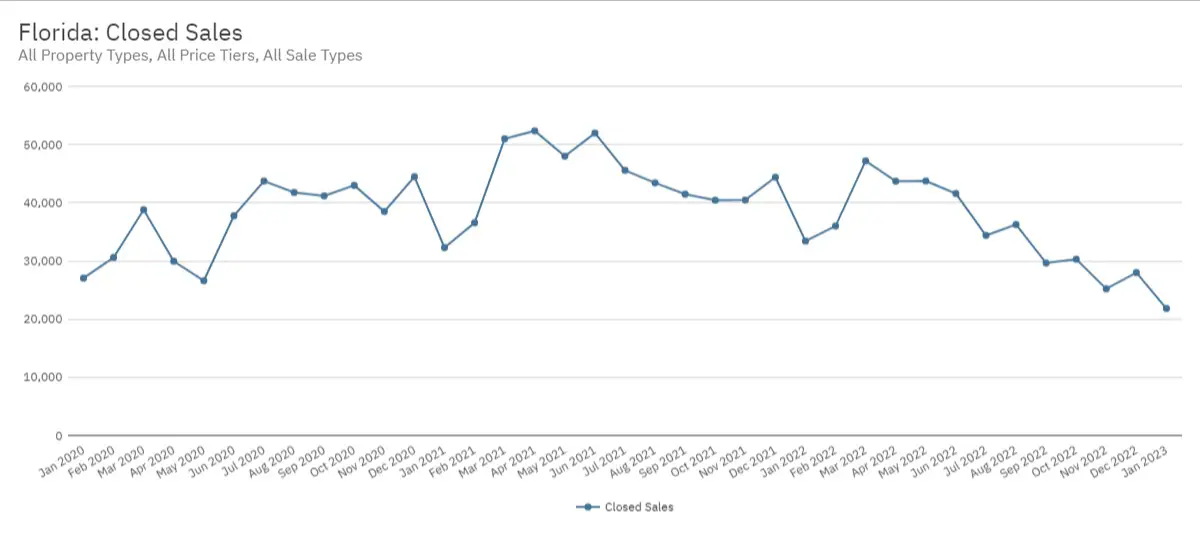
Closed Sales – Month by Month
| Month | Closed Sales | % Change YOY |
| Jan. 2023 | 21,825 | -34.7% |
| Dec. 2022 | 27,994 | -36.9% |
| Nov. 2022 | 25,210 | -37.7% |
| Oct. 2022 | 30,298 | -25.1% |
| Sept. 2022 | 29,654 | -28.5% |
| Aug. 2022 | 36,263 | -16.5% |
| Jul. 2022 | 34,389 | -24.6% |
| June 2022 | 41,594 | -20.0% |
| May 2022 | 43,747 | -8.9% |
| Apr. 2022 | 43,710 | -16.5% |
| Mar. 2022 | 47,203 | -7.5% |
| Feb. 2022 | 36,006 | -1.5% |
Median Sales Prices – January 2023
Median sale prices continue to exceed their year-over-year averages but continue to decline since peaking in June 2022. During the month of January 2023, the median sale price across all property types was $360,000, up 5.0% year-over-year but down considerably from the peak ($388,990).
It does appear that a downward trend is in place.
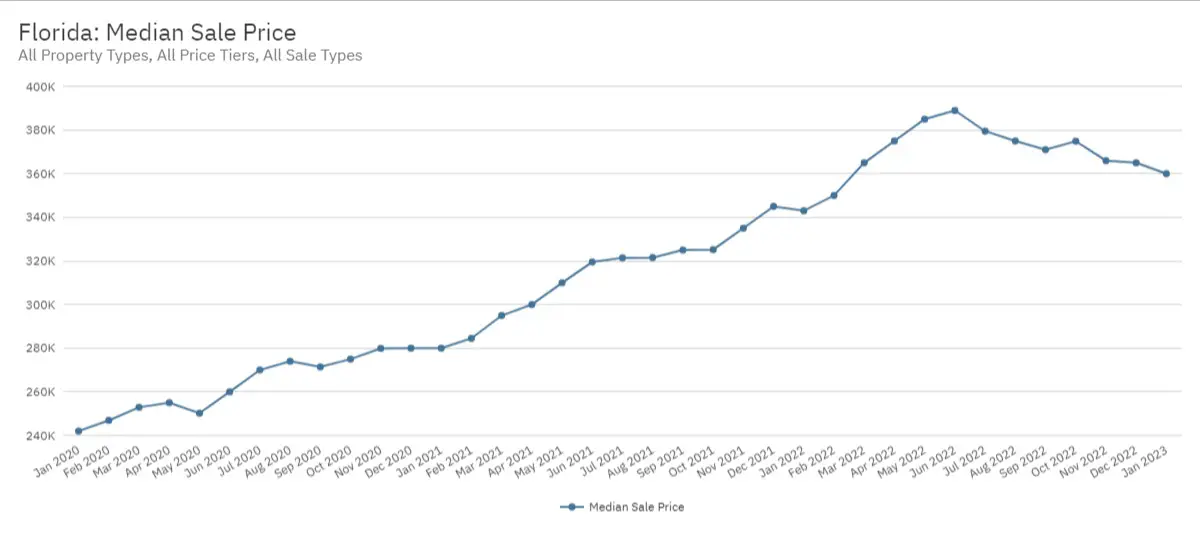
Median Price – Month by Month
| Month | Median Sale Price | % Change YOY |
| Jan. 2023 | $360,000 | 5.0% |
| Dec. 2022 | $365,000 | 5.8% |
| Nov. 2022 | $365,900 | 9.3% |
| Oct. 2022 | $374,900 | 15.3% |
| Sept. 2022 | $370,990 | 14.2% |
| Aug. 2022 | $375,000 | 16.6% |
| Jul. 2022 | $379,500 | 18.1% |
| June 2022 | $388,990 | 21.7% |
| May 2022 | $385,000 | 24.2% |
| Apr. 2022 | $375,000 | 25.0% |
| Mar. 2022 | $365,000 | 23.7% |
| Feb. 2022 | $350,000 | 23.0% |
Active Inventory – January 2023
Active inventory across all property types continues to improve throughout the state. For the month January 2023, inventory is up by 114.7% year-over-year to 100,798 units. This represents an increase of more than 50,000 units from the 46,944 active homes on the market as of the end of January 2022.
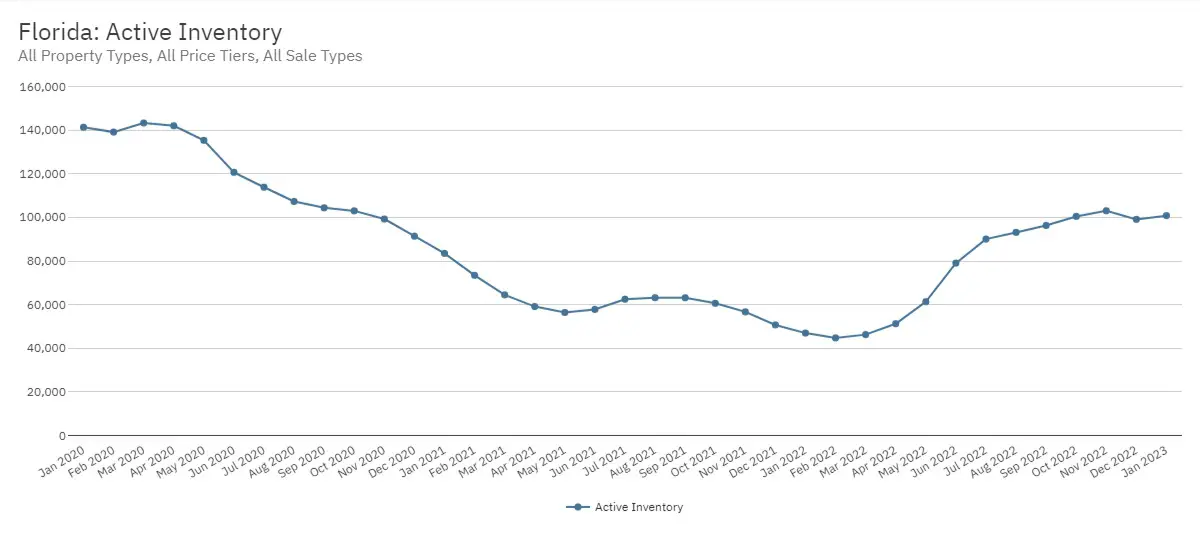
Active Inventory – Month by Month
| Month | Active Inventory | % Change YOY |
| Jan. 2023 | 100,798 | 114.7% |
| Dec. 2022 | 99,084 | 95.5% |
| Nov. 2022 | 103,016 | 81.8% |
| Oct. 2022 | 100,428 | 65.7% |
| Sept. 2022 | 96,277 | 52.5% |
| Aug. 2022 | 93,101 | 47.4% |
| Jul. 2022 | 90,022 | 44.1% |
| June 2022 | 79,015 | 36.7% |
| May 2022 | 61,318 | 8.8% |
| Apr. 2022 | 51,234 | -13.3% |
| Mar. 2022 | 46,247 | -28.2% |
| Feb. 2022 | 44,417 | -39.1% |
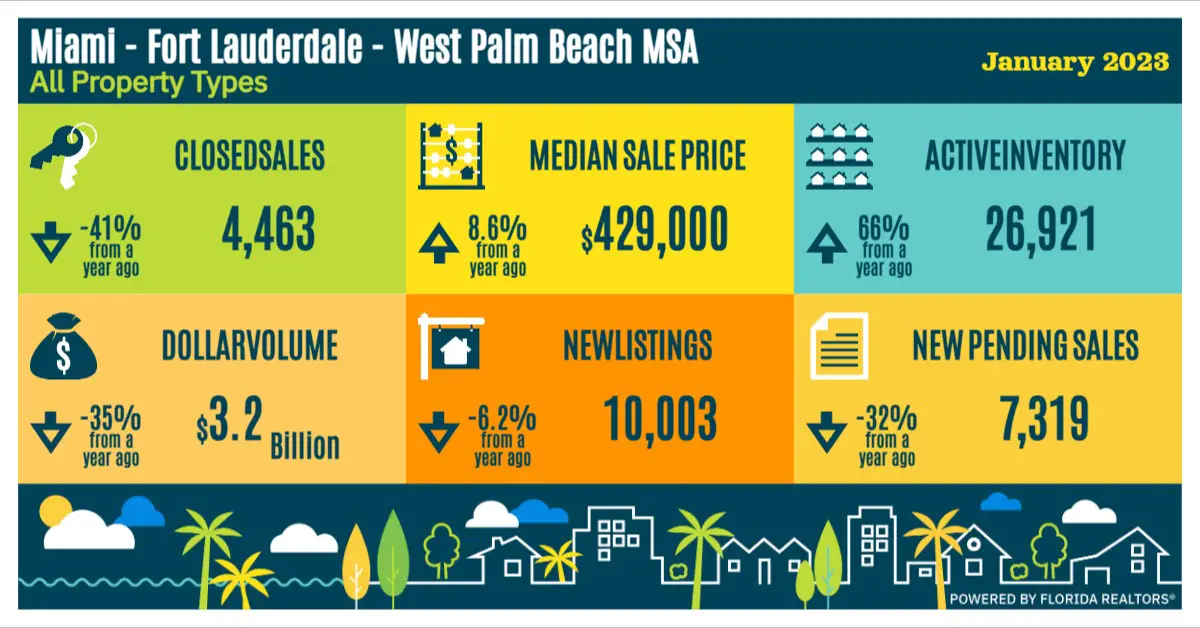
The South Florida Housing Market
The South Florida existing-home market has continued its trend of lower overall sales. Closed sales during January 2023 were down 41% year-over-year to 4,463 units. The overall dollar volume also declined by 35% to $3.2 billion.
The median home price across all property types for January 2023 increased by 8.6% to $429,000 year-over-year.
Inventory improved with approximately 27,000 homes across all property types available for sale within South Florida. New listings across the tri-county area were down by 6.2% to 10,003.
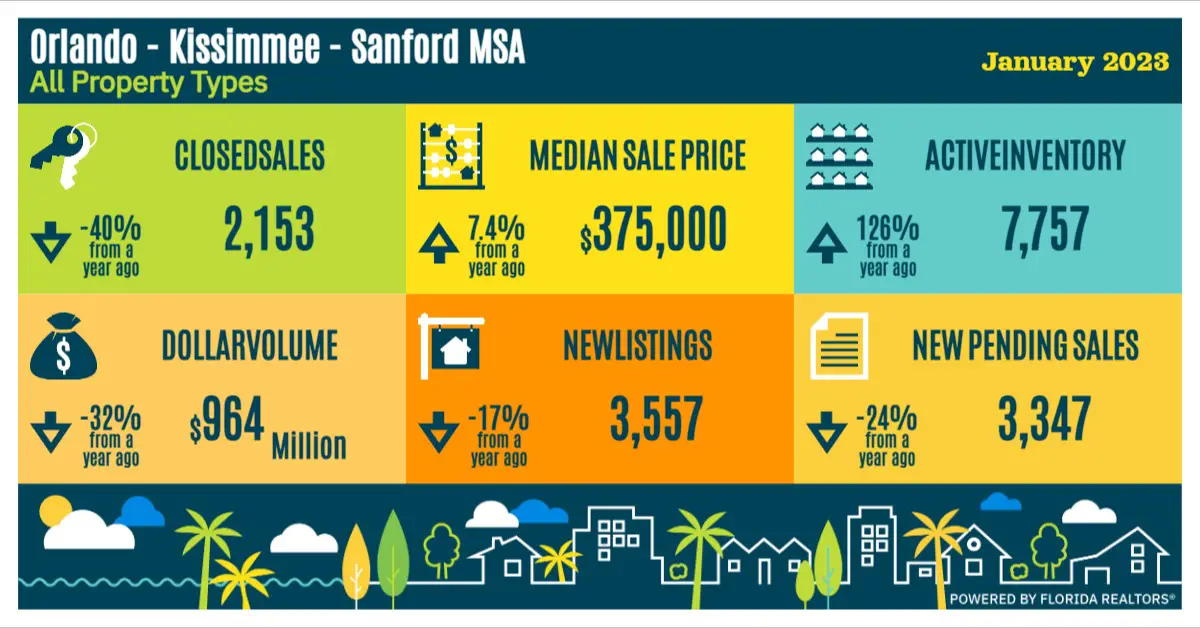
The Greater Orlando Housing Market
The Orlando – Kissimmee – Sanford existing home market continued its slowdown in sales during the month of January 2023. Closed sales of 2,153 were down 40% year-over-year along with the overall dollar volume which was down by 32% to less than $1 billion.
The median home price across all property types increased by 7.4% to $375,000 year-over-year.
Inventory levels continued to improve with 7,757 homes across all property types available for sale, up 126% from a year ago. New listings across the metro area were down by 17% to 3,557 units while new pending sales are down by 24% to 3,347 units.
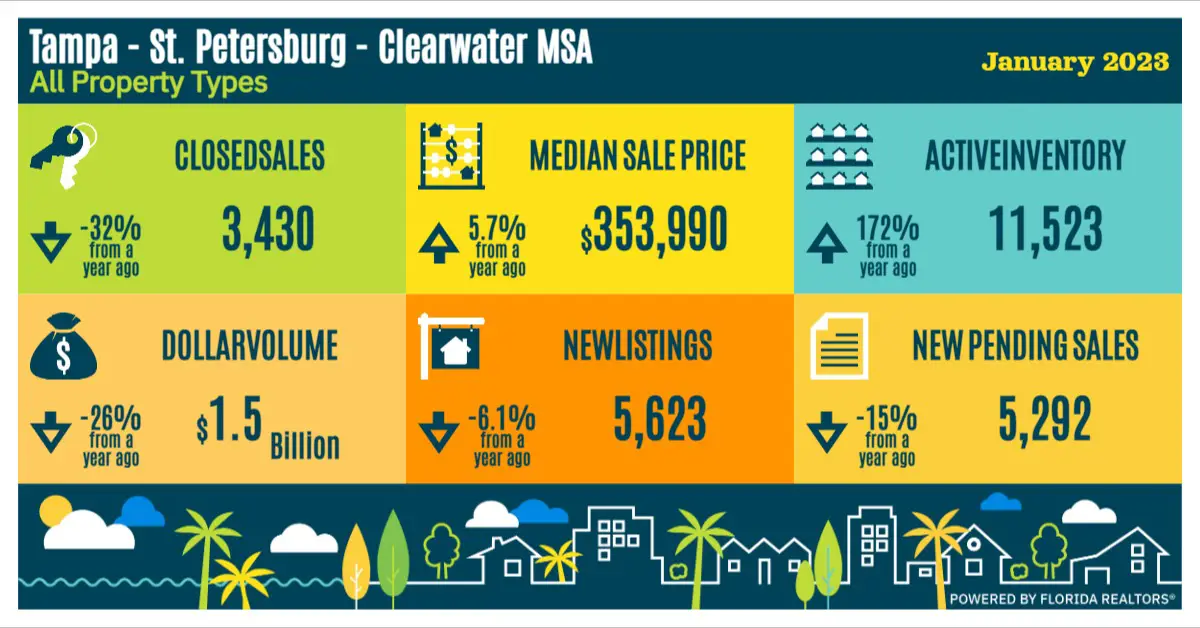
The Tampa Bay Housing Market
The Tampa – St. Petersburg – Clearwater MSA continued it’s downward trend. Existing-home sales were down 32% year-over-year to 3,430 units while dollar volume was also down by 26% to $1.5 billion.
The median home price across all property types for January 2023 increased by 5.7% to $353,990 year-over-year.
Inventory levels have improved by a staggering 172% (year-over-year) with 11,523 homes across all property types available for sale. New listings across the metro area were down 6.1% while new pending sales were down by 15% to 5,292 units.
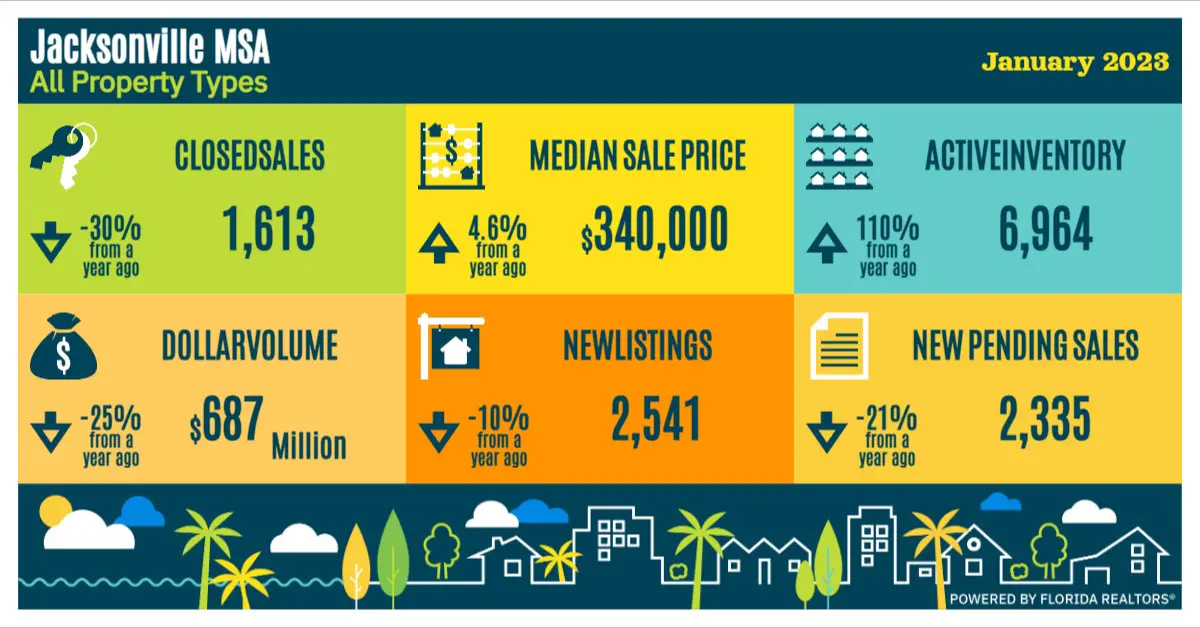
The Greater Jacksonville Housing Market
During the month of January, the greater Jacksonville housing market continued to experience slower activity with respect to home sale transactions. Closed sales of 1,613 were down 30% year-over-year and the overall dollar volume was also down by 25% to $687 million.
Prices across all property types continue to rise with the median home price increasing by 4.6% year-over-year to $340,000.
Inventory continues to improve with approximately 7,000 homes across all property types available for sale within the greater Jacksonville area, a 1110% increase year-over-year. New listings were down 10% to 2,541 homes while new pending sales declined by 21% to 2,335 homes.
Are you thinking of selling?
Based on the most recent data, the current state of the residential market is changing fast. If you are a homeowner and are considering selling your personal residence, vacation home or investment property, now may be the perfect time to do so while prices are still strong.
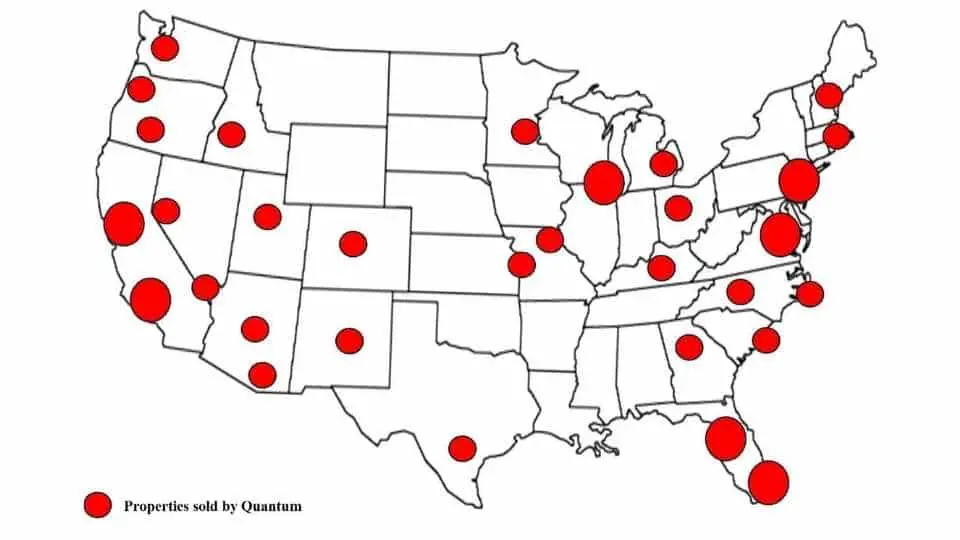
Our team has assisted sellers not only throughout the state of Florida, but in most major markets nationwide. We take a highly methodical and deliberate approach when working with or clients and have specific strategies to help get the best value for the property.
To learn more about how we help our clients get the best possible price for their property, visiting our web site or contact us at info@quantumcos.com.
