For the first quarter 2022, single-family home market within the South Florida MSA (Miami-Dade, Broward and Palm Beach counties) still remains strong but appears to be in a transitional state with declining single-family home sales and increasing prices.
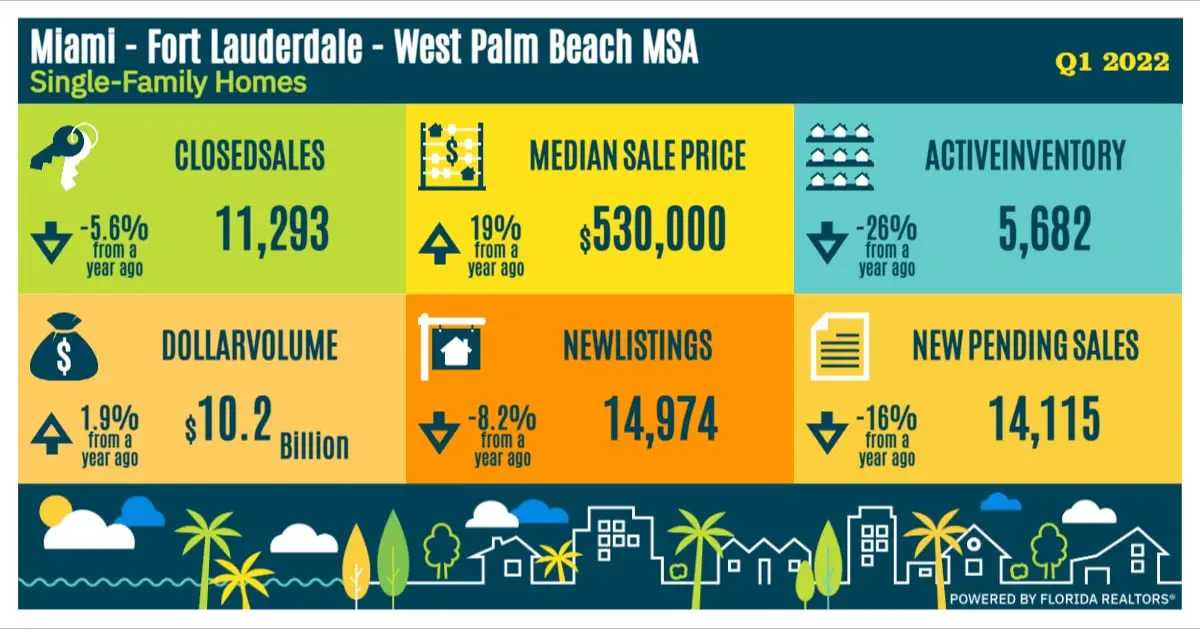
According to FloridaRealtors, there were a total of 11,293 existing single-family home sales throughout South Florida during the first quarter 2022. This represents a 5.6% decline from the number of existing single-family sale transactions completed during the first quarter 2021 (11,966). Of the total, approximately 35% or 3,871 transactions were conducted using cash.
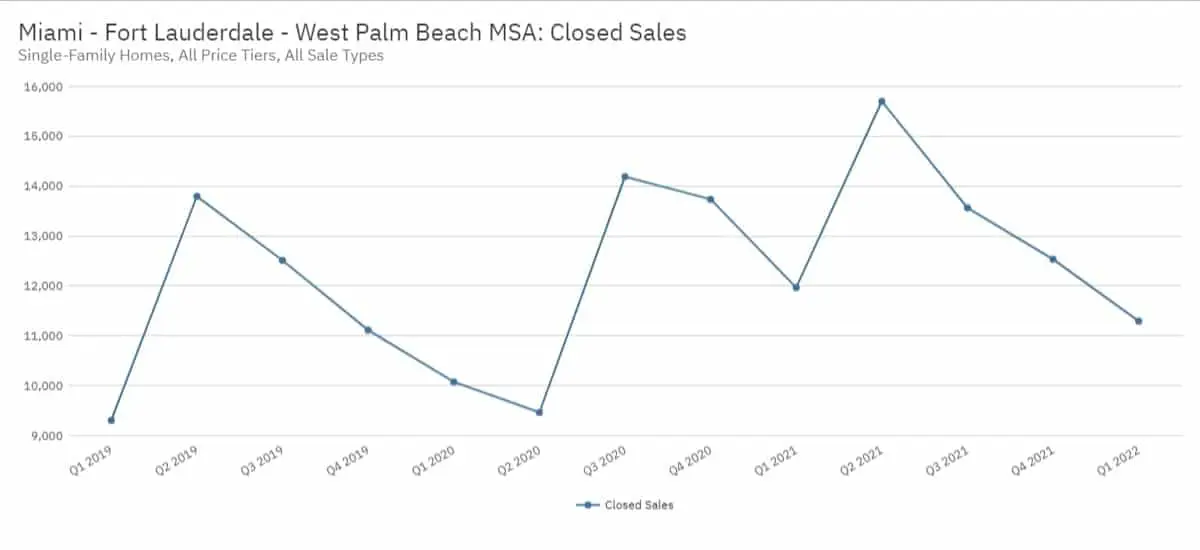
The number of closed sales have declined over the past four quarters and are indicated to be as follows:
- Q1 2022 – 11,293 (down 5.6% year-over-year)
- Q4 2021 – 12,533 (down 8.8% year-over-year)
- Q3 2021 – 13,565 (down 4.4% year-over-year)
- Q2 2021 – 15,701 (up 66% year-over-year)
- Q1 2021 – 11,966 (up 18.8% year-over-year)
- Q4 2020 – 13,735 (up 23.6% year-over-year)
Based on the current level of activity, it is anticipated that the number of overall sales of existing single-family homes will continue to decline due to limited inventory levels, rising interest rates and record high home prices.
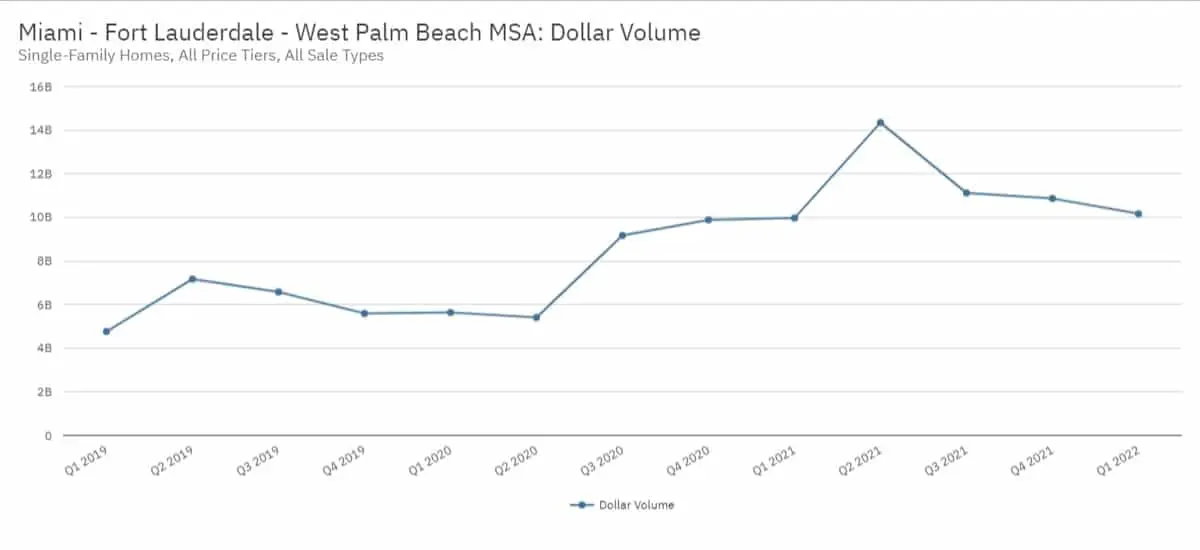
Overall dollar sales volume during the first quarter 2022 was $10.2 billion which is fairly stable on a year-over-year basis, up by just 1.9%. This is also down from the fourth quarter 2021 amount of $10.9 billion and well behind the recent peak of $14.3 billion as of the second quarter 2021.
- Q1 2022 – $10.2 billion (up 1.9% year-over-year)
- Q4 2021 – $10.9 billion (up 9.9% year-over-year)
- Q3 2021 – $11.1 billion (up 21.3% year-over-year)
- Q2 2021 – $14.3 billion (up 165.2% year-over-year)
- Q1 2021 – $10.0 billion (up 76.9% year-over-year)
- Q4 2020 – $9.9 billion (up 76.7%% year-over-year)
Single Family Home Sale Prices (First Quarter 2022)
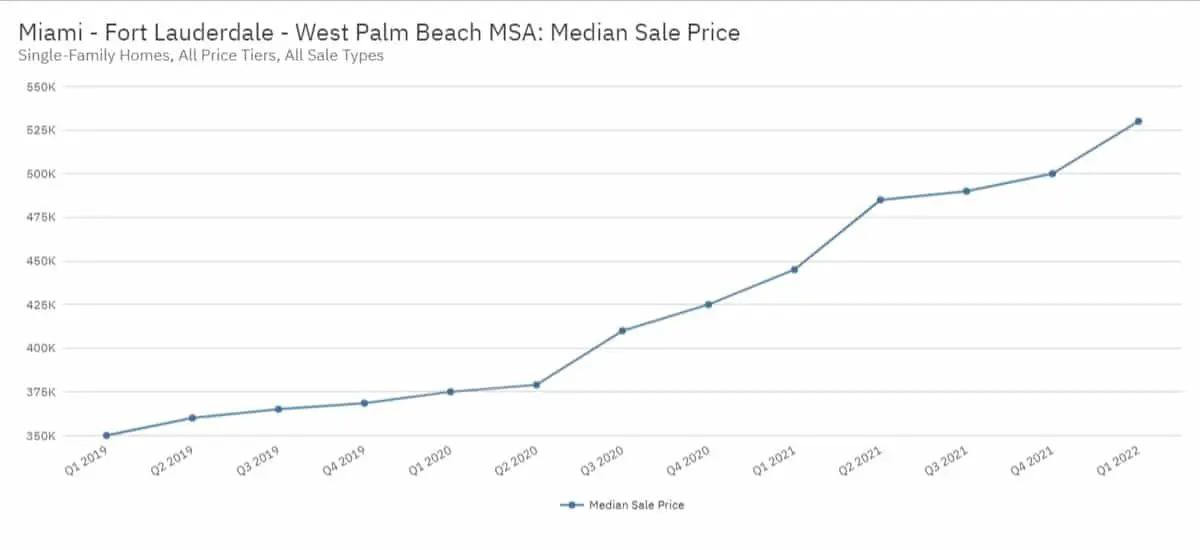
The median sale price is one of the preferred statistical methods for measuring price activity as it is not as sensitive of extraordinary high or low sale prices (that are not typical of a particular market area) which can easily skew the values.
For the first quarter 2022, the median sale price for existing single-family home sale transactions in South Florida was $530,000 which is 19.1% higher than that observed for during the first quarter 2021. It does appear, however, that the trend of rising prices is starting to slow.
- Q1 2022 – $530,000 (up 19.1% year-over-year)
- Q4 2021 – $500,000 (up 17.6% year-over-year)
- Q3 2021 – $490,000 (up 19.5% year-over-year)
- Q2 2021 – $485,000 (up 28.0% year-over-year)
- Q1 2021 – $445,000 (up 18.7% year-over-year)
- Q4 2020 – $425,000 (up 15.3%% year-over-year)
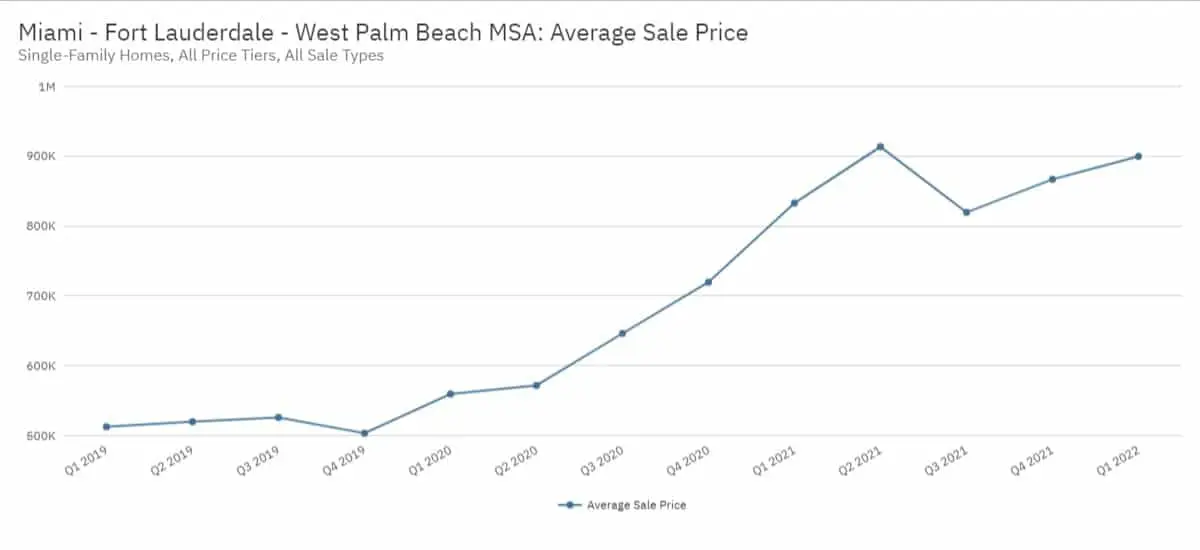
For the same period, the average sale price for single-family home sale transactions in South Florida was $889,780. This amount is 8% higher than the first quarter 2021 and largely driven by a 12.2% increase in the sale of homes over $1,000,000.
- Q1 2022 – $899,780 (up 8.0% year-over-year)
- Q4 2021 – $866,924 (up 20.5% year-over-year)
- Q3 2021 – $819,638 (up 26.8% year-over-year)
- Q2 2021 – $913,563 (up 59.8% year-over-year)
- Q1 2021 – $832,986 (up 48.9% year-over-year)
- Q4 2020 – $719,594 (up 43%% year-over-year)
Single Family Home Inventory Levels (First Quarter 2022)
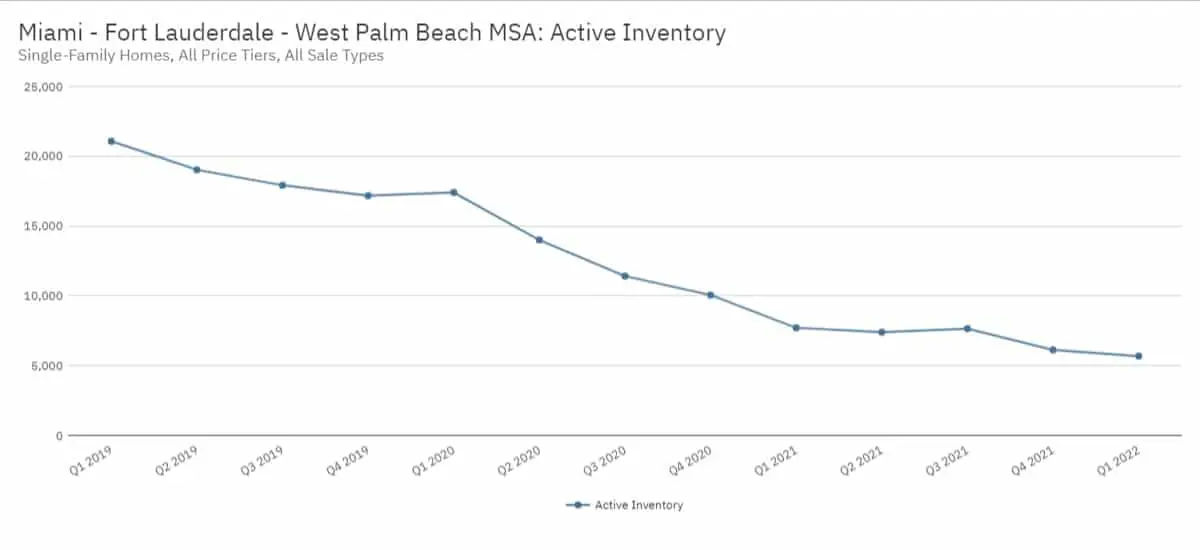
Inventory is the number of active property listings on the market for sale at any given point in time. This particular statistic is one of the main components in a healthy real estate market.
As of the end of the first quarter 2022, there was a staggeringly low 5,682 single-family homes available for sale throughout South Florida which is a 26.3% decline from the amount of inventory as of the end of first quarter 2021. In the past three years, overall inventory has been extraordinary low compared to historical levels.
- Q1 2022 – 5,682 homes (down 26.3% year-over-year)
- Q4 2021 – 6,126 homes (down 39.1% year-over-year)
- Q3 2021 – 7,650 homes (down 33.0% year-over-year)
- Q2 2021 – 7,397 homes (down 47.2% year-over-year)
- Q1 2021 – 7,711 homes (down 55.7% year-over-year)
- Q4 2020 – 10,052 homes (down 41.5% year-over-year)
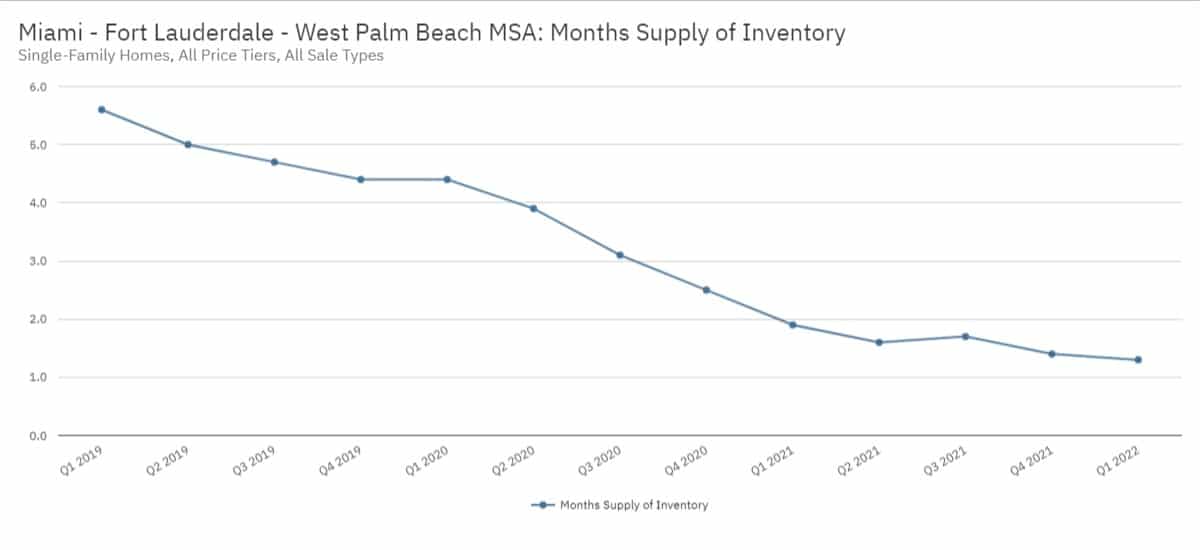
The months supply of single-family home inventory as of the end of the first quarter 2022 was also historically low. At the current pace of sales, there is less than 1.5 two months of inventory available for sale in South Florida which is down 31.6% from the first quarter 2021.
- Q1 2022 – 1.3 months supply (down 31.6% year-over-year)
- Q4 2021 – 1.4 months supply (down 44.0% year-over-year)
- Q3 2021 – 1.7 months supply (down 45.2% year-over-year)
- Q2 2021 – 1.6 months supply (down 59.0% year-over-year)
- Q1 2021 – 1.9 months supply (down 56.8% year-over-year)
- Q4 2020 – 2.5 months supply (down 43.2% year-over-year)
Although overall inventory is down substantially, the number of new single-family home listings were put onto the market during 2022 decreased by 8.2% (from the first quarter 2021) to 14,971 as sellers take advantage of the increasing prices. It should be noted, however, there is an increase in listings quarter-over-quarter (12,876 during Q4 2021).
- Q1 2022 – 14,974 homes (down 8.2% year-over-year)
- Q4 2021 – 12,876 homes (down 10.2% year-over-year)
- Q3 2021 – 15,790 homes (down 2.0% year-over-year)
- Q2 2021 – 17,913 homes (up 28.0% year-over-year)
- Q1 2021 – 16,315 homes (down 0.3% year-over-year)
- Q4 2020 – 14,334 homes (up 0.9% year-over-year)
Due to demand levels and low inventory, the number of new listings are increasingly higher price points continues to grow. Following is a table of new Q1 2022 single-family listings at individual price points.
| Initial Listing Price Point | New Listings | % Change (YOY) |
| Less than $50,000 | 13 | -23.5% |
| $50,000 – $99,999 | 24 | -54.7% |
| $100,000 – $149,999 | 54 | -57.8% |
| $150,000 – $199,999 | 101 | -70.5% |
| $200,000 – $249,999 | 252 | -59.2% |
| $250,000 – $299,999 | 603 | -53.4% |
| $300,000 – $399,000 | 2,232 | -38.1% |
| $400,000 – $599,000 | 4,715 | -4.2% |
| $600,000 – $999,999 | 3,721 | 35.2% |
| $1 million or more | 3,199 | 25.8% |
As of the end of the first quarter 2022, the following table will show the number of active property listings at individual price points.
| Current Listing Price Point | New Listings | % Change (YOY) |
| Less than $50,000 | 0 | -100% |
| $50,000 – $99,999 | 10 | -68.8% |
| $100,000 – $149,999 | 16 | -75.8% |
| $150,000 – $199,999 | 22 | -87.4% |
| $200,000 – $249,999 | 82 | -70.6% |
| $250,000 – $299,999 | 162 | -64.6% |
| $300,000 – $399,000 | 619 | -46.1% |
| $400,000 – $599,000 | 1,293 | -24.5% |
| $600,000 – $999,999 | 1,294 | -3.6% |
| $1 million or more | 2,184 | -11.9% |
Are you thinking of selling?
Based on the year-end 2021 data, the current state of the market is highly favorable for seller. If you are a homeowner and are considering selling your personal residence, vacation home or investment property, not may be the perfect time to do so.
Our team has assisted sellers not only throughout the state of Florida, but in most major markets nationwide. We take a highly methodical and deliberate approach when working with or clients and have specific strategies to help get the best value for the property.
Contact us at info@quantumcos.com or learn more by visiting our web site at www.QuantumRealtyAdvisors.com.
The information provided in this website was derived from sources deemed to be reliable to is not guaranteed or warranted. All information, content, and materials available on this site are for general informational purposes only.