
As per the National Association of Realtors (NAR), homes sales were up slightly but priced declined year over year. The median existing US home sale price during the month of May 2023 was down 3.1% year-over-year from $408,600 to $396,100 across all housing types. Similar to the prior month, prices increased in the Midwest and Northeast but declined in the West and South.
Sale transactions were up slightly, increasing by 0.2% (month-over-month) in May 2023. On a year-over-year basis, sales transactions were down 20.4% to a seasonally adjusted annual rate of 4.30 million units.
Per Lawrence Yun, NAR’s chief economist, “Mortgage rates heavily influence the direction of home sales,”. He further stated, “Relatively steady rates have led to several consecutive months of consistent home sales.”
Existing home inventory was down 6.1% year-over-year to 1.08 million units. Based on the current pace of sales, there is a 2.6-month supply of homes on the market at this time. The average marketing time for the month was 18 days, down from 22 as of April 2023 but up from 16 days year-over-year.
Investors and vacation / second home buyers, purchased 15% of all homes sold in May, down slightly from 16% year-over-year.

The Florida Housing Market
Closed sale transactions across the state of Florida continue to decline on a year-over-year basis. During the month of May 2023 there were 39,267 sale transactions across all property types, a year-over-year decline of 10.2%.
Median sale prices continued their rise for 2023 but remained flat on a year-over-year basis. The median sale price of $385,000 in May 2023 is slightly less than the recent peak of $388,990 in June 2022.
Active inventory has also remained in a tight range since summer 2022. As of May 2023, active inventory was 94,791 units, up 54.6%. Based on the current rate of home sales, there is a 2.9 month supply of inventory currently available for sale.
Closed Sales – May 2023
The number of closed sales transactions within the state of Florida has continued to decline on year-over-year basis. As of May 2023, the number of individual closed sales declined by 10.2% to 39,267 transactions.
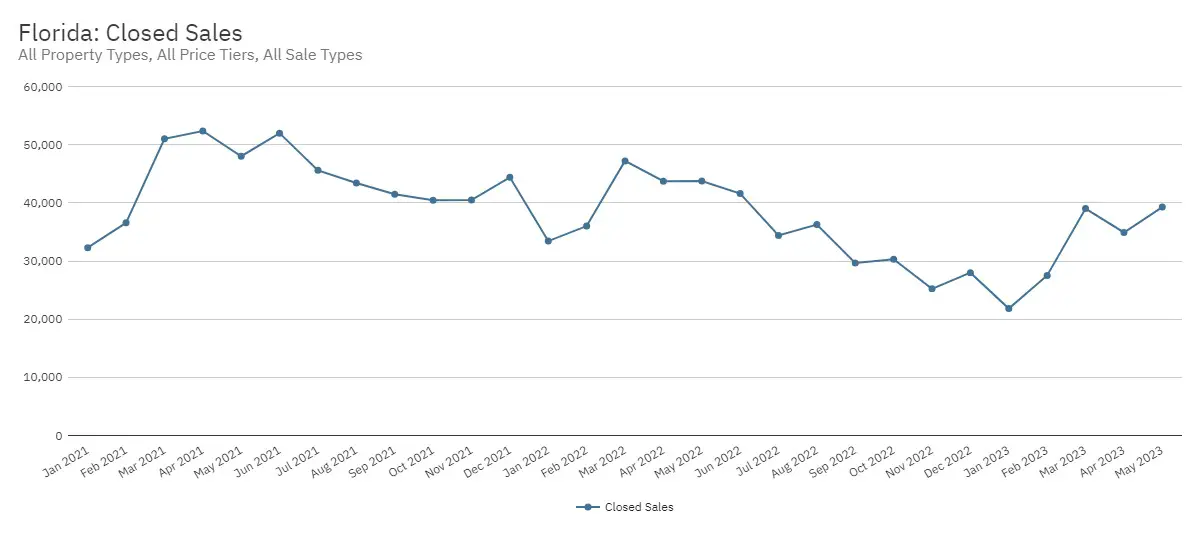
Closed Sales – Month by Month
| Month | Closed Sales | % Change YOY |
| May 2023 | 39,267 | -10.2% |
| Apr 2023 | 34,906 | -20.1% |
| Mar 2023 | 39,016 | -17.3% |
| Feb 2023 | 27,514 | -23.6% |
| Jan 2023 | 21,825 | -34.7% |
| Dec 2022 | 27,994 | -36.9% |
| Nov 2022 | 25,210 | -37.7% |
| Oct 2022 | 30,298 | -25.1% |
| Sept 2022 | 29,654 | -28.5% |
| Aug 2022 | 36,263 | -16.5% |
| July 2022 | 34,389 | -24.6% |
| June 2022 | 41,594 | -20.0% |
| May 2022 | 43,747 | -8.9% |
Median Sales Prices – May 2023
Since the beginning of 2023, home prices in Florida have continued to make strong gains. During the month of May 2023, the median sale price across all property types was $385,000 which was unchanged on a year-over-year basis.
The recent peak occurred in June 2022 with a price of $388,990.
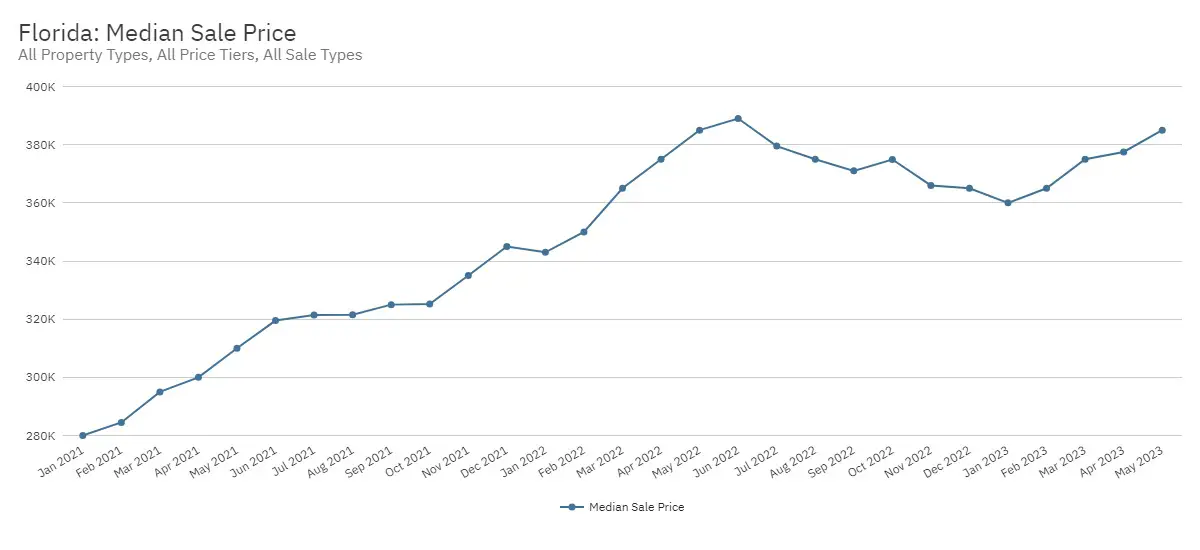
Median Price – Month by Month
| Month | Median Price | % Change YOY |
| May 2023 | $385,000 | 0.0% |
| Apr 2023 | $377,500 | 0.7% |
| Mar 2023 | $375,000 | 2.7% |
| Feb 2023 | $365,000 | 4.3% |
| Jan 2023 | $360,000 | 5.0% |
| Dec 2022 | $365,000 | 5.8% |
| Nov 2022 | $365,990 | 9.3% |
| Oct 2022 | $374,900 | 15.3% |
| Sept 2022 | $370,990 | 14.2% |
| Aug 2022 | $375,000 | 16.6% |
| July 2022 | $379,500 | 18.1% |
| June 2022 | $388,990 | 21.7% |
| May 2022 | $385,000 | 24.2% |
Active Inventory – May 2023
Although active inventory across all property types continues to improve throughout the state, the trend has leveled over the past several months. During May 2023, inventory is up by 54.6% year-over-year to 94,791 units. This represents an increase of approximately 50,000 units from the 46,944 active homes on the market as of the end of January 2022.
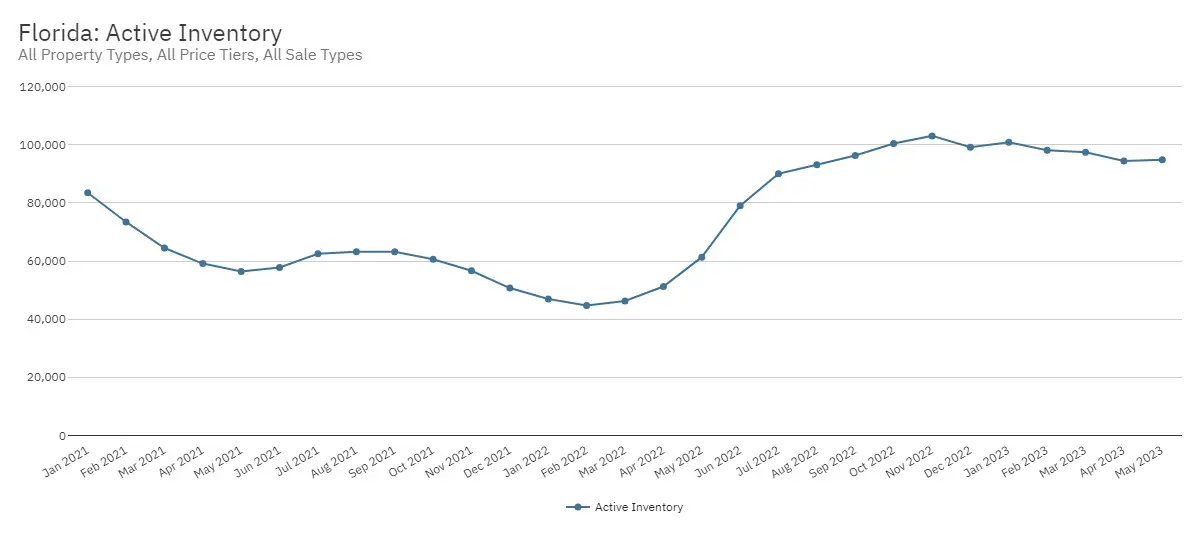
Active Inventory – Month by Month
| Month | Active Inventory | % Change YOY |
| May 2023 | 94,791 | 54.6% |
| Apr 2023 | 94,366 | 84.2% |
| Mar 2023 | 97,392 | 110.6% |
| Feb 2023 | 98,073 | 119.3% |
| Jan 2023 | 100,798 | 114.7% |
| Dec 2022 | 99,084 | 95.5% |
| Nov 2022 | 103,016 | 81.8% |
| Oct 2022 | 100,428 | 65.7% |
| Sept 2022 | 96,277 | 52.5% |
| Aug 2022 | 93,101 | 47.4% |
| July 2022 | 90,022 | 44.1% |
| June 2022 | 79,015 | 36.7% |
| May 2022 | 61,318 | 8.8% |
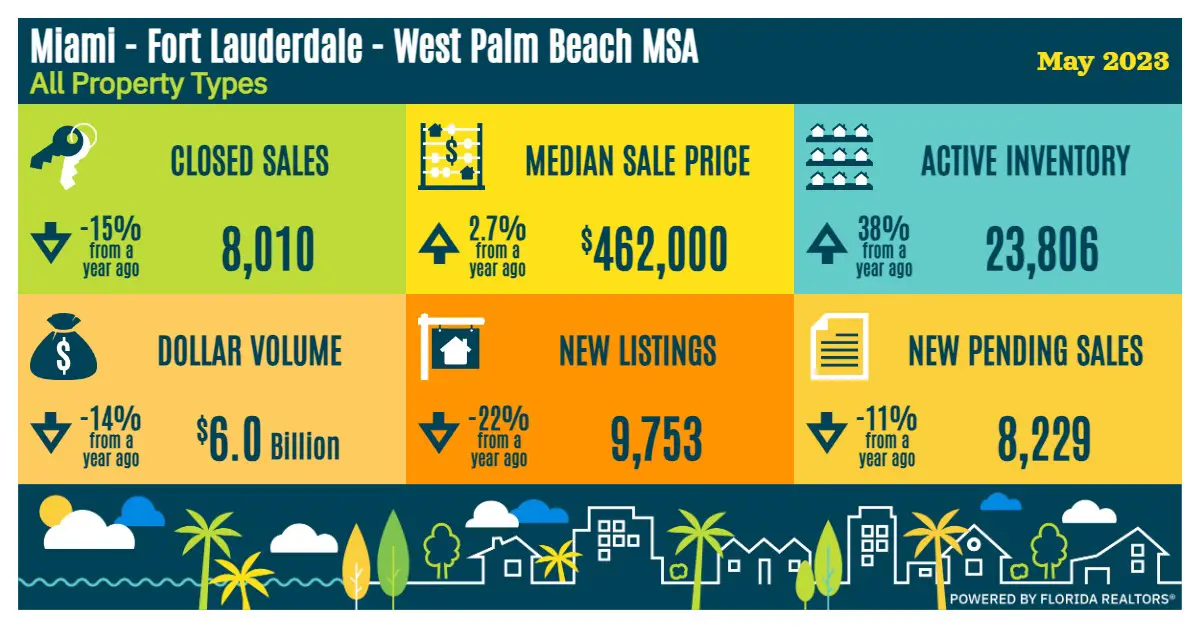
The South Florida Housing Market
The South Florida existing-home market continues the trending of lower overall home sales. Closed sales during the month were down 15% year-over-year to 8.010 units. The overall dollar volume also declined by 14% to $6.0 billion.
The median home price across all property types for May 2023 increased by 2.7% to $462,000 year-over-year.
Inventory improved with approximately 24,000 homes across all property types available for sale within South Florida. New listings across the tri-county area were down by 22% to 9,753.
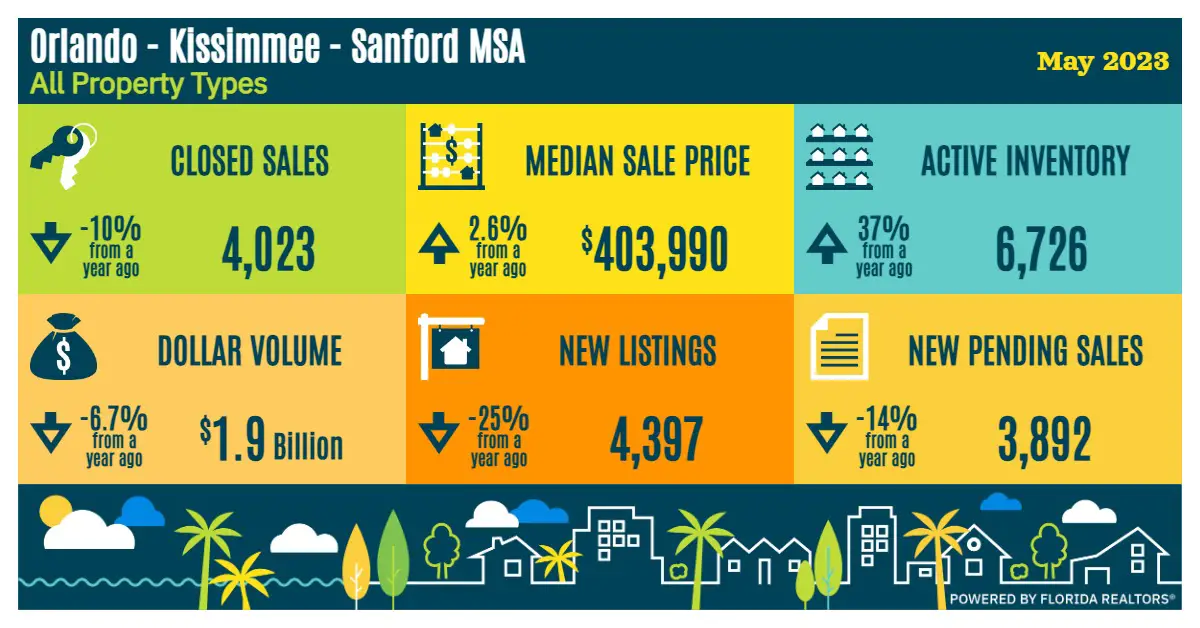
The Greater Orlando Housing Market
The greater Orlando existing home market continued its trend of a slowdown in sales. Closed sales of 4,023 during the month of May were down by 10% year-over-year along with the overall dollar volume sliding by 6.7% to $1.9 billion.
The median home price across all property types improved by 2.6% to $403,990 year-over-year.
Inventory levels continued to improve with 6,726 homes across all property types available for sale, up 37% from a year ago. New listings across the Orlando metro area was down by 25% to 4,397 units while new pending sales are down by 14% to 3,892 units.
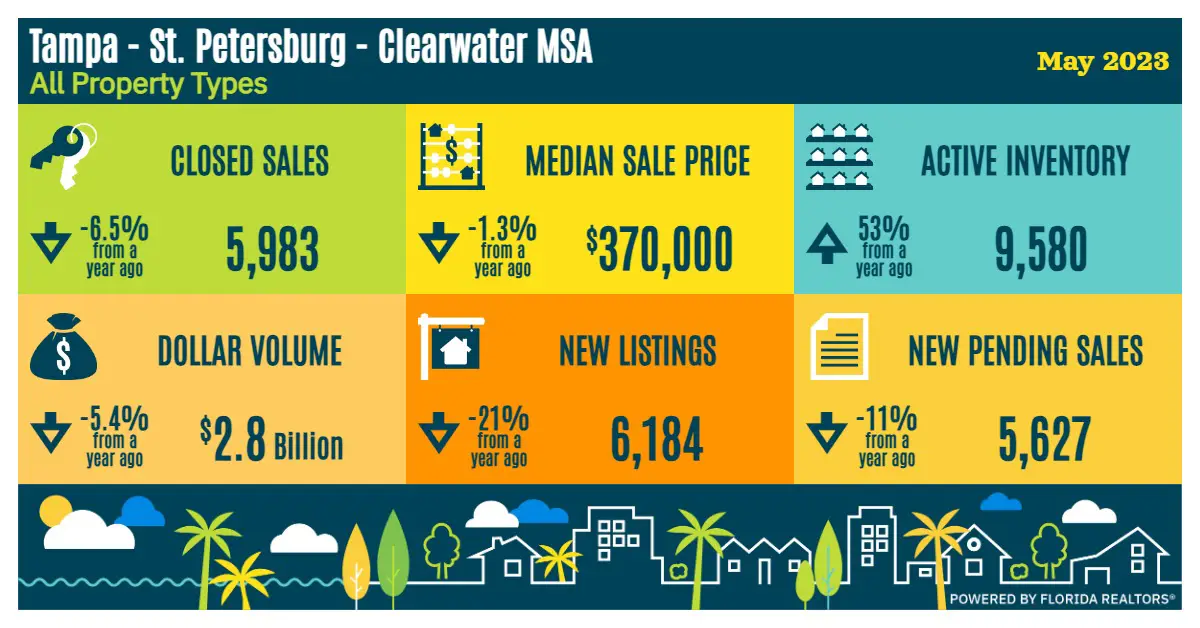
The Tampa Bay Housing Market
The Tampa – St. Petersburg – Clearwater MSA also continued it’s downward trend with respect to sale transactions. Existing-home sales were down 6.5% year-over-year to 5,983 units while dollar volume slid by 5.4% to $2.8 billion.
The median home price across all property types for May 2023 increased by 1.3% to $370,000 year-over-year.
Active inventory levels have improved, increasing 53% (year-over-year) with 9,580 homes across all property types available for sale. New listings across the metro area were down by 21% while new pending sales were down by 11% to 5,627 units.
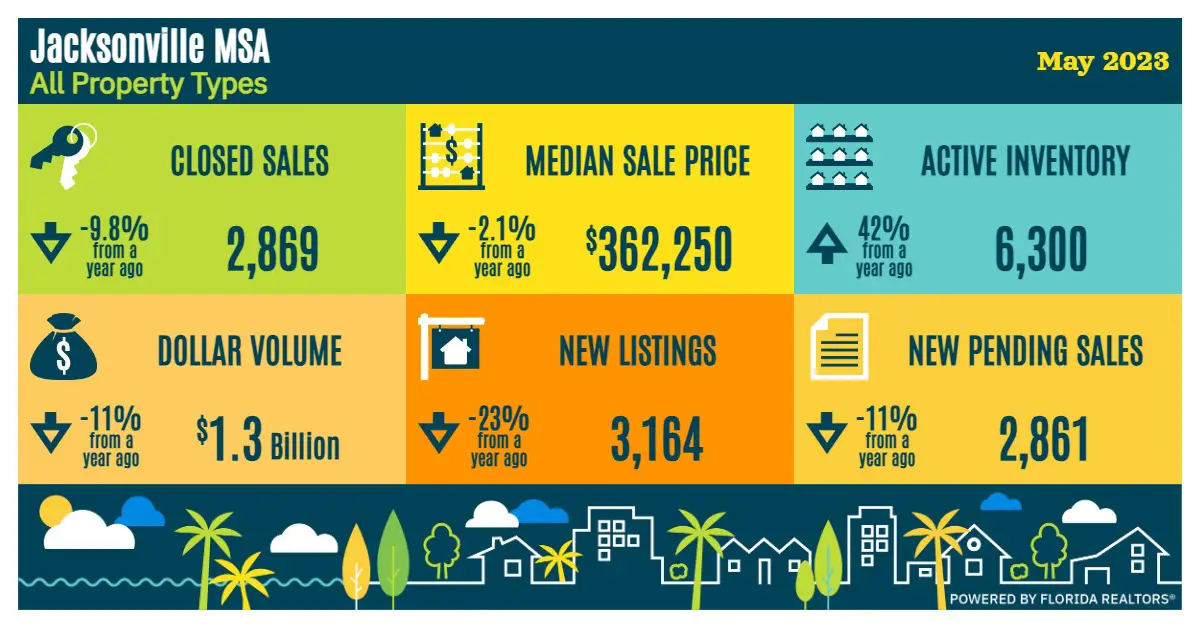
The Greater Jacksonville Housing Market
The greater Jacksonville housing market continued to experience slower activity during the month of May 2023. Closed sales of 2,869 were down 9.8% year-over-year and the overall dollar volume was also down by 11% to $1.3 billion.
Prices across all property types were down with the median home price declining by 2.1% year-over-year to $362,250.
Inventory continues to improve with 6,300 homes across all property types available for sale within the greater Jacksonville area, a 42% increase year-over-year. New listings were down 23% to approximately 3,100 homes while new pending sales declined by 11% to 2,861 units.
Are you thinking of selling?
Based on the most recent data, the current state of the residential market is changing fast. If you are a homeowner and are considering selling your personal residence, vacation home or investment property, now may be the perfect time to do so while prices are still strong.
Our team has assisted sellers not only throughout the state of Florida, but in most major markets nationwide. We take a highly methodical and deliberate approach when working with or clients and have specific strategies to help get the best value for the property.
To learn more about how we help our clients get the best possible price for their property, visiting our web site or contact us at info@quantumcos.com.